Is the gold price poised for a big rally?
When even the little guy is sure of where the market is heading, it can only mean one thing. Get ready for a major disappointment.
Get the latest financial news, insights and expert analysis from our award-winning MoneyWeek team, to help you understand what really matters when it comes to your finances.
You are now subscribed
Your newsletter sign-up was successful
Want to add more newsletters?

Twice daily
MoneyWeek
Get the latest financial news, insights and expert analysis from our award-winning MoneyWeek team, to help you understand what really matters when it comes to your finances.

Four times a week
Look After My Bills
Sign up to our free money-saving newsletter, filled with the latest news and expert advice to help you find the best tips and deals for managing your bills. Start saving today!
In every great bull and bear market, there is a central idea that runs through the trading community and acts as the main focal point for traders. This idea must appear simple to grasp and obvious' to the vast majority. A 'difficult to understand' economic theory would not do the trick.
For example, driving the great gold bull market from the pre-millennium to the top in 2011 was the almost universal belief that the gold price was inversely joined to the value of the US dollar and this was being devalued by the enormous build-up in federal and state debt.
The gold bulls believed that at some point in the near future, the dollar would become virtually worthless as the debt load ballooned and the economy would suffer from hyperinflation due to the massive increase in money supply.
MoneyWeek
Subscribe to MoneyWeek today and get your first six magazine issues absolutely FREE

Sign up to Money Morning
Don't miss the latest investment and personal finances news, market analysis, plus money-saving tips with our free twice-daily newsletter
Don't miss the latest investment and personal finances news, market analysis, plus money-saving tips with our free twice-daily newsletter
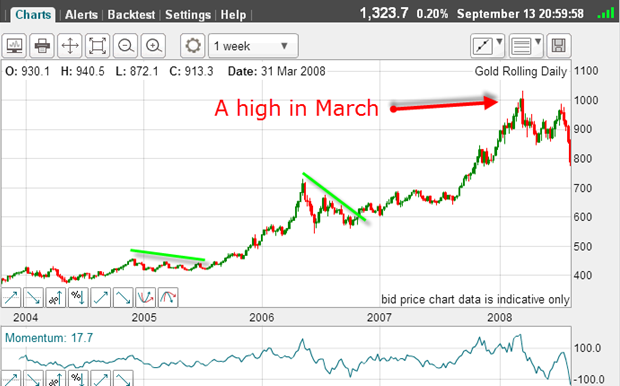
It all sounded so right, did it not? US debt was certainly exploding, and the gold price was by and large following the EUR/USD chart.
Here is gold 2004-2008:
And here is EUR/USD in the same period:
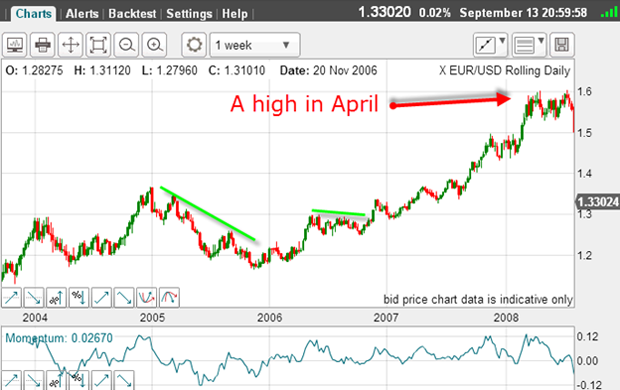
You can see from the charts that gold was indeed tracking the euro in this period up to mid-2008 at least.
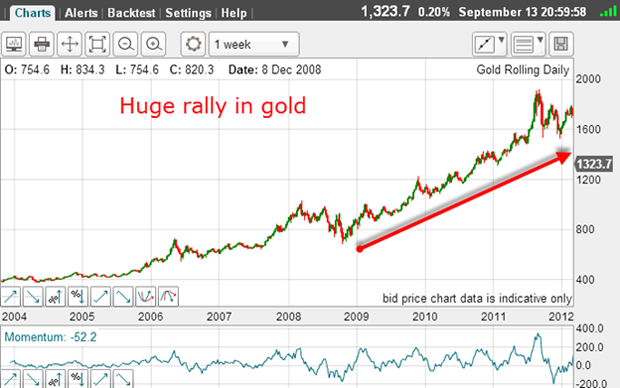
But then came the credit crunch and suddenly, the game changed. The link between gold and the dollar was well and truly broken.
Here is the period up to the top in 2011 in gold a most magnificent rally:
And here is the same period in EUR/USD:
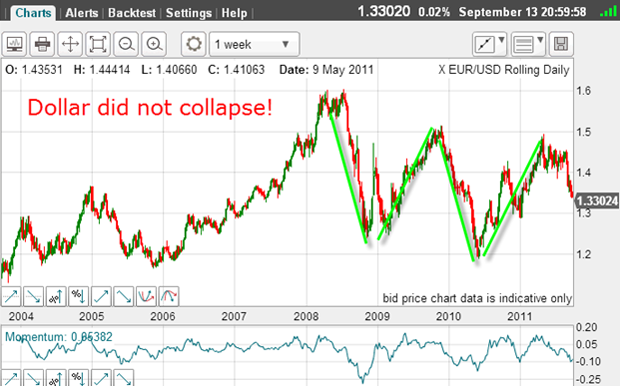
This break of the link was a clear sign that the old story of hyperinflation was incorrect, but how many gold bugs could see it? My guess is just a precious few. Why? It is the same story. When their belief system coincides with the market, most think they are geniuses and untouchable by loss.
In the downturn, the vast majority believe they are still geniuses and are ever so reluctant to give up the very belief system that has brought them so much success. It's age-old human nature at work.
I read many comments on blogs on gold around this time, and the overwhelming impression was a total disbelief that the game had changed they refused to see that their hyperinflation would never arrive, but they were still advising all to batten down the hatches and even buy more on the dip'.
Well, that dip has stretched to $700 off the top, so far.
Will the majority be misled again?
Simply because we have today a very similar dynamic working, not only in gold and silver, but in Treasuries and stocks. But the idea driving this market is a variation on the old one.
Today, stocks are making huge bull runs, Treasuries are making new lows, as are gold and silver. The expectation is high that the Fed will have to announce that it intends to taper' (start reducing its monthly shopping list from $85bn) its bond purchases as early as Wednesday, but not by enough to derail the stock market advance.
The thinking is that even if the Fed does start only a small-scale reduction, it will still send a signal to the market that the main bond buyer is withdrawing, and there appears no large-scale buyer in the wings to take its place.
China and India, who have been major buyers in the past, are reducing their purchases, as they have problems of their own. They are unlikely to be huge buyers again soon. In fact, they have been net sellers recently.
It seems obvious that Treasuries (and gilts) will fall and yields rise and this belief is endemic in the vast majority of blogs and comments I read today.
So, the thinking goes, if interest rates are really on the rise, why not switch out of gold and silver which earn no interest, and are weakening anyway and into Fed-supported stocks or ultra-safe Treasuries, where yields are rapidly improving (ten-year T-notes yielded 3% last week)?
So far, the switch to Treasuries is not yet occurring on any scale. But funds have been moving into equities from gold already.
This all seems obvious, does it not?
The crucial point is that it appears obvious to the small trader and is being bought hook, line and sinker.
In addition, all of the sentiment data I follow confirm that traders have solidly positioned themselves ahead of Wednesday's announcement aligned to the above idea.
I think you know where I am going with this! Yes, I am sensing this is a perfect set-up for a major disappointment for this majority.
In other words, with gold having made the lovely A-B-C relief rally I showed in my last gold post on 6 September, and the big decline off the C wave high to Friday's low, is the market set for a large counter-trend rally?
Here is the hourly chart:
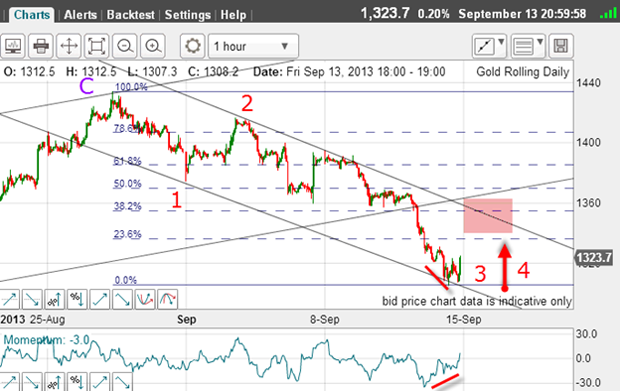
From the C wave top, I can count wave 1, wave 2 and Friday's low at the $1,300 level is wave 3 down (long and strong). And I have a superb tramline pair working with Friday's lows hitting the line nicely.
Also, there is a large positive-momentum divergence at the low.
This is a classic set-up for a large relief rally.
So, if this count is correct, I expect a wave 4 up and the pink zone around $1,360 appears a likely target. A break of the upper tramline would be very interesting.
The commercials have turned bullish on gold
| (Contracts of 100 Troy ounces) | Row 0 - Cell 1 | Row 0 - Cell 2 | Row 0 - Cell 3 | Open interest: 384,164 | ||||
| Commitments | ||||||||
| 141,506 | 72,782 | 19,183 | 184,972 | 265,196 | 345,661 | 357,161 | 38,503 | 27,003 |
| Changes from 09/03/13 (Change in open interest: -4,420) | ||||||||
| -10,445 | -978 | 3,507 | 7,111 | -5,126 | 173 | -2,597 | -4,593 | -1,823 |
| Percent of open in terest for each category of traders | ||||||||
| 36.8 | 18.9 | 5.0 | 48.1 | 69.0 | 90.0 | 93.0 | 10.0 | 7.0 |
| Number of traders in each category (Total traders: 287) | ||||||||
| 112 | 82 | 66 | 64 | 65 | 213 | 181 | Row 8 - Cell 7 | Row 8 - Cell 8 |
Indeed, yes. Both hedge funds and small traders have unloaded long trades by a large margin. And the commercials have scaled up their longs and reduced shorts at the same time. Much of the time, the commercials get it right!
So the scene is set for a possible bounce off my lower tramline and this could arrive around the time the Fed is speaking on Wednesday.
Already this morning as I write, gold has popped to the $1,335 area on reaction to the Fed Chairman appointment news.
One possible scenario is this: at such a date-certain market-moving event, we often see spike moves such as a big down and then big up (and vice versa).
Then, stops are being run (in both directions), leaving the stage mainly to the pros.
We could see a new low in a spike and then a big rally that is one scenario I will be looking for on Wednesday. But with the market finely poised, a rapid advance would be entirely possible.
Get the latest financial news, insights and expert analysis from our award-winning MoneyWeek team, to help you understand what really matters when it comes to your finances.
John is is a British-born lapsed PhD physicist, who previously worked for Nasa on the Mars exploration team. He is a former commodity trading advisor with the US Commodities Futures Trading Commission, and worked in a boutique futures house in California in the 1980s.
He was a partner in one of the first futures newsletter advisory services, based in Washington DC, specialising in pork bellies and currencies. John is primarily a chart-reading trader, having cut his trading teeth in the days before PCs.
As well as his work in the financial world, he has launched, run and sold several 'real' businesses producing 'real' products.
-
 Should you buy an active ETF?
ETFs are often mischaracterised as passive products, but they can be a convenient way to add active management to your portfolio
-
 Power up your pension before 5 April – easy ways to save before the tax year end
With the end of the tax year looming, pension savers currently have a window to review and maximise what’s going into their retirement funds – we look at how