The next major move in gold is down
Gold has put in a top, but the market is spiky. John C Burford applies Elliott wave theory to the charts to find his next target price.
Get the latest financial news, insights and expert analysis from our award-winning MoneyWeek team, to help you understand what really matters when it comes to your finances.
You are now subscribed
Your newsletter sign-up was successful
Want to add more newsletters?

Twice daily
MoneyWeek
Get the latest financial news, insights and expert analysis from our award-winning MoneyWeek team, to help you understand what really matters when it comes to your finances.

Four times a week
Look After My Bills
Sign up to our free money-saving newsletter, filled with the latest news and expert advice to help you find the best tips and deals for managing your bills. Start saving today!
In my last post on gold on 14 August, I asked, is the gold rally over?
As it happened, I was a little premature, but this morning it appears we have seen the top to the rally off the infamous late June plunge low of $1,180.
Let's take a look at the situation last month:
MoneyWeek
Subscribe to MoneyWeek today and get your first six magazine issues absolutely FREE

Sign up to Money Morning
Don't miss the latest investment and personal finances news, market analysis, plus money-saving tips with our free twice-daily newsletter
Don't miss the latest investment and personal finances news, market analysis, plus money-saving tips with our free twice-daily newsletter
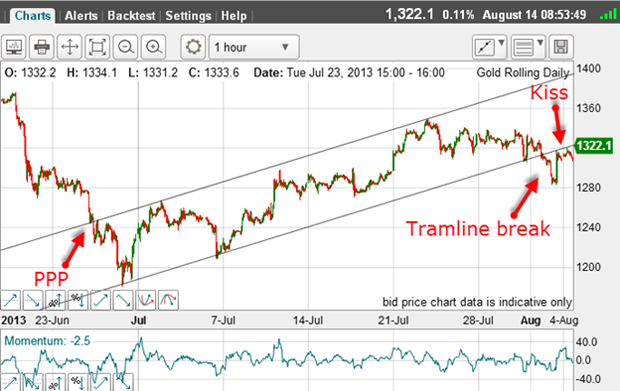
I have a superb tramline pair working, and on 2 August, the lower tramline was decisively broken. Then, the market rallied back for a traditional kiss before peeling away down again.
So far, it's textbook stuff. The original tramline and the kiss were excellent shorting opportunities. It appeared that my A-B-C labels were the correct ones, and that the market would resume its bear market decline after putting in the C wave top.
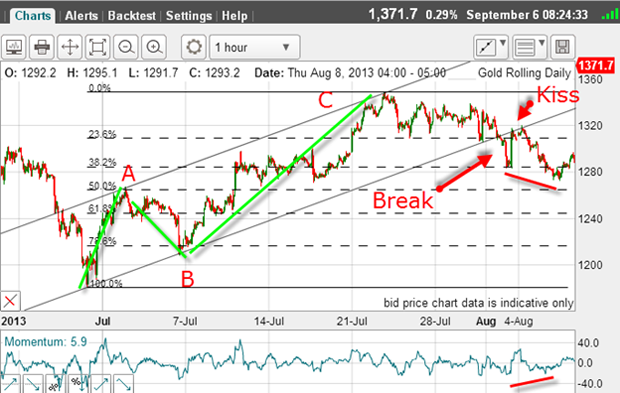
Sticking to my strategy, when I had a significant high in place at the 23 July high, I applied my Fibonacci retrace levels. Remember, they give me guides for possible turning zones for likely counter-trend moves.
The first tramline break was turned at the precise Fibonacci 38% retrace level before the kiss rally. Then, the market declined to below the 38% level and the stage was set for an assault on the 50% level.
But as the market declined, the momentum did not follow (see red bars). This is a crucial point since the decline was turned around before the 50% level was reached. That was a give-away for a possible turn.
This was setting up the possibility that the relief rally had not yet completed and that my original A-B-C pattern may give way to an even larger A-B-C.
This is always a very real possibility when dealing with A-B-C relief moves, and we need to be prepared for such an event.
And when the market rallied back into the trading channel and overcame the old 23 July high, the odds were greatly swinging towards a new larger A-B-C pattern scenario:
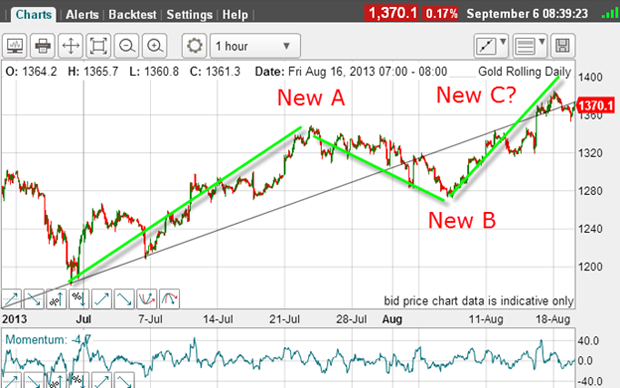
The question was: how high would wave C carry?
To help answer this question, I like to see a clear five wave pattern within C waves. If I can see this, then I can home in on a likely top because five waves mean a completed move.
Also, I like to see a Fibonacci relationship between the A and C waves usually an equality relationship is the most common.
I then set about measuring the waves. The height of my new A wave is $160. My B wave low is $1,275. Projecting the $160 height onto the B wave gives a C wave top target of $1,434.
The high on 28 August was $1,434.10. I call that a direct hit.
Thus, by using the simple equality of the A and C wave rule, I was able to forecast a likely upper limit for the entire rally from the June low.
This is invaluable information which you can use in your work.
But is there a five wave complete pattern to the C wave?
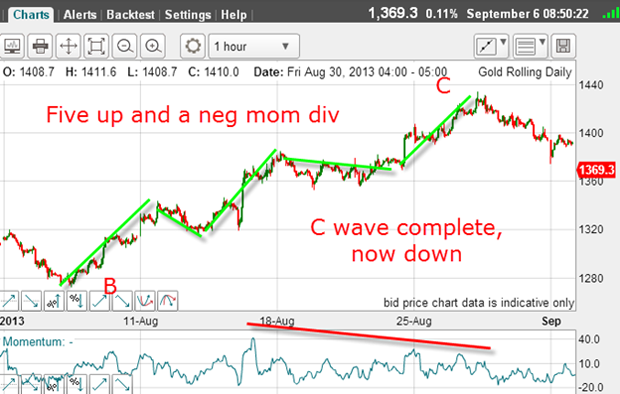
It is not textbook, but it is there and with a huge negative-momentum divergence.
It is time to examine the daily chart to see where we are in the big picture.
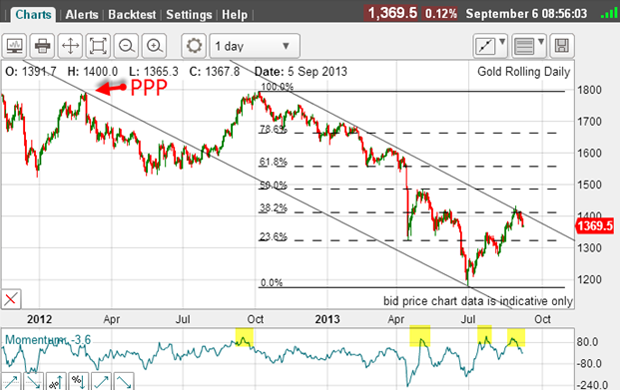
I have a great tramline pair working, and the C wave has carried to the upper line where it meets the Fibonacci 38% retrace level. The A-B-C waves really stand out here.
Also, momentum has become overbought at the C wave top and it lies in an area where previous tops were put in (highlighted).
Putting all of this evidence together, I have an almost water-tight case for saying the relief rally top is in and I believe the next major moves will be down.
The remarkable power of Elliot waves
One solution is to give your trades more room with stop placement than is usual. Another is to enter on rallies only. It is horses for courses.
I think it's remarkable that just by using a simple Elliott wave interpretation of the chart, you can set reliable price targets well in advance.
Get the latest financial news, insights and expert analysis from our award-winning MoneyWeek team, to help you understand what really matters when it comes to your finances.
John is is a British-born lapsed PhD physicist, who previously worked for Nasa on the Mars exploration team. He is a former commodity trading advisor with the US Commodities Futures Trading Commission, and worked in a boutique futures house in California in the 1980s.
He was a partner in one of the first futures newsletter advisory services, based in Washington DC, specialising in pork bellies and currencies. John is primarily a chart-reading trader, having cut his trading teeth in the days before PCs.
As well as his work in the financial world, he has launched, run and sold several 'real' businesses producing 'real' products.
-
 Inheritance tax investigations net HMRC an extra £246m from bereaved families
HMRC embarked on almost 4,000 probes into unpaid inheritance tax in the year to last April, new figures show, in an increasingly tough crackdown on families it thinks have tried to evade their full bill
-
 Average UK house price reaches £300,000 for first time, Halifax says
While the average house price has topped £300k, regional disparities still remain, Halifax finds.