If you want to make money, don’t marry your trades
Past success doesn't mean future profits, says John C Burford. Trust the charts and be ready to change your position at a moment's notice.
Get the latest financial news, insights and expert analysis from our award-winning MoneyWeek team, to help you understand what really matters when it comes to your finances.
You are now subscribed
Your newsletter sign-up was successful
Want to add more newsletters?

Twice daily
MoneyWeek
Get the latest financial news, insights and expert analysis from our award-winning MoneyWeek team, to help you understand what really matters when it comes to your finances.

Four times a week
Look After My Bills
Sign up to our free money-saving newsletter, filled with the latest news and expert advice to help you find the best tips and deals for managing your bills. Start saving today!
On Wednesday, I covered the S&P 500 index, which is the most traded futures stock index market in the world (in the shape of the e-mini S&P, which is one-fifth the size of the big contract). The latest COT (commitments of traders) data shows that the open interest (number of outstanding futures contracts) in the e-mini is about 2.8 million, while open interest in the big contract is only a little over 100,000.
For comparison, open interest in the e-mini Nasdaq is about 266,000 and in the e-mini Dow is a paltry 60,000 contracts. The e-mini S&P is heavily favoured by day traders and offers ample liquidity for trades of any size.
And on Wednesday, I noted that the market was very likely preparing for a substantial bounce off the Fibonacci 78% support level here is the chart I showed:
MoneyWeek
Subscribe to MoneyWeek today and get your first six magazine issues absolutely FREE

Sign up to Money Morning
Don't miss the latest investment and personal finances news, market analysis, plus money-saving tips with our free twice-daily newsletter
Don't miss the latest investment and personal finances news, market analysis, plus money-saving tips with our free twice-daily newsletter
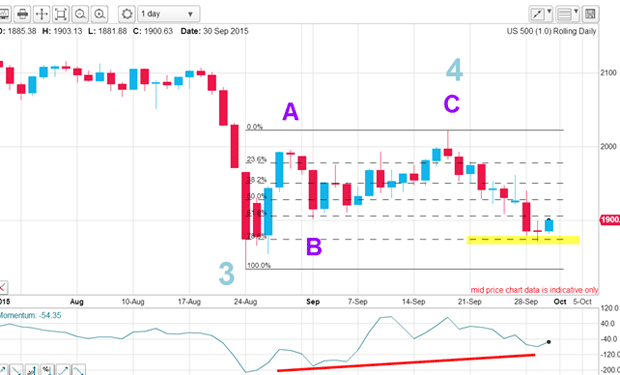
And this is what I wrote: "This morning, the rally has extended, lending weight to the conclusion that the combination of Fibonacci level and large momentum divergence will likely lead to a strong counter-trend rally." Here is the current hourly chart showing the likely Fibonacci targets for the bounce:
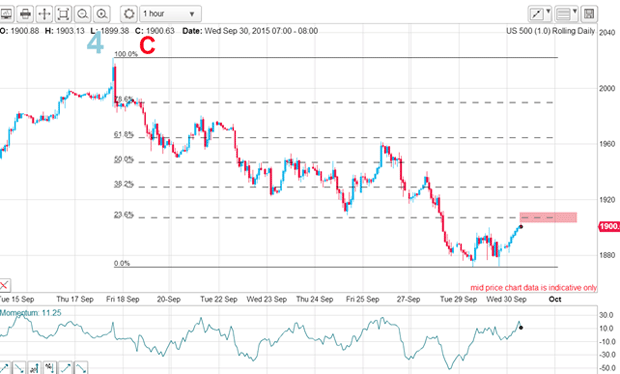
"The first is the Fibonacci 23% level just ahead with higher levels possible."
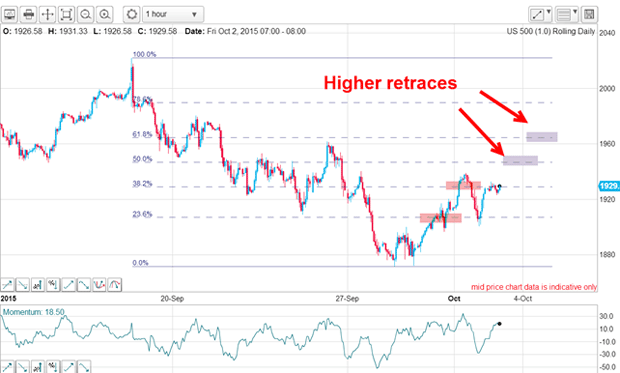
Later on Wednesday and into yesterday, the market proved that higher levels were indeed possible. Not only possible, but highly probable. Below is the current hourly chart. The rally has made it to the original target at 23%, hit the 38% level yesterday and appears on its way towards one of the higher retrace levels:
But what trader action was indicated on Wednesday when the market hit the Fibonacci 78% support level on a strong positive-momentum divergence (see first chart above)?
For shorter-term trades, that was the signal to cover at least some of your shorts and even take a long trade in anticipation of a decent-sized rally. Now, I understand that is a very gutsy policy in the eyes of some traders.
And that is where your own personality comes to the fore. If you find it difficult to rapidly switch sides in a flash even when presented with such compelling signs as were given, reversing positions will be a tough choice.
Most people achieve a sense of comfort when the market is going their way and the natural attitude is this: if it ain't broke, why fix it? Why abandon a position when it is working so well?
But that is not the optimum attitude for a short-term swing trader. He/she must be always on the alert for Mr Market to take away his or her hard-earned gains. The attitude should always be: I have a winning position; can I see anything on my charts that would indicate taking the profit now and possibly reversing position?
One method I use to achieve this reversal is the 'V' entry. Below is a close-up of Wednesday's action. At Tuesday's low, the market traced out an inverted 'V' and then proceeded to rally above the apex. A stop-and-reverse order could be placed in this region and that method would have the benefit of taking emotion out of the picture:
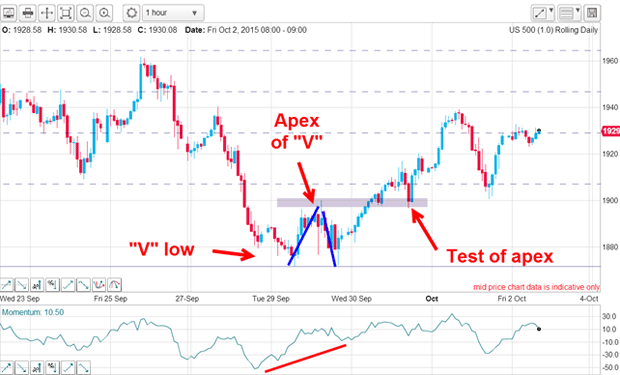
Note that the next two dips were stopped in the area of the apex before resuming a clear indication that the market really did want to continue the rally. A break below the grey zone would tell me the rally was on weak legs and abandoning the long trade was a good option.
So what is the outlook this morning? Below is one possibility. I have a very good tramline pair working with the market approaching the upper tramline. The rally off Wednesday's low could be wave A of an A-B-C with wave C traversing the upper tramline. I have drawn in T3 as a possible target if the market can break above the upper tramline with force:
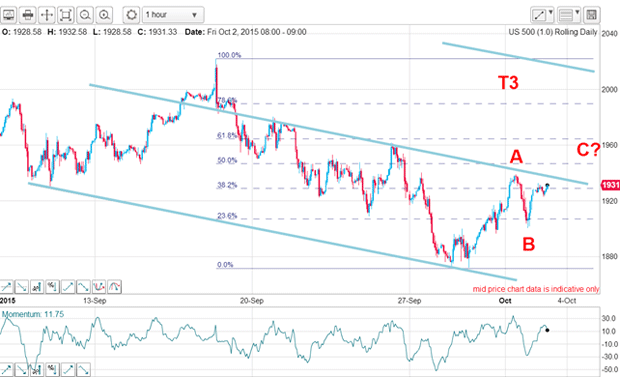
But first, the market must overcome the Fibonacci 50% and 62% levels which are the most formidable resistance levels.
Alternatively, the market could simply reverse back down off the upper tramline area. That possibility means that the profit on the long trades from Wednesday could be protected by raising sell stops. That would guarantee a good profit. In addition, the trade could be reversed again in a repeat enactment of my stop-and-reverse 'V' entry method.
There is no doubt that the enhanced volatility of stock indexes is offering alert traders plenty of scope for rapid-fire trades.
Get the latest financial news, insights and expert analysis from our award-winning MoneyWeek team, to help you understand what really matters when it comes to your finances.
John is is a British-born lapsed PhD physicist, who previously worked for Nasa on the Mars exploration team. He is a former commodity trading advisor with the US Commodities Futures Trading Commission, and worked in a boutique futures house in California in the 1980s.
He was a partner in one of the first futures newsletter advisory services, based in Washington DC, specialising in pork bellies and currencies. John is primarily a chart-reading trader, having cut his trading teeth in the days before PCs.
As well as his work in the financial world, he has launched, run and sold several 'real' businesses producing 'real' products.
-
 Average UK house price reaches £300,000 for first time, Halifax says
While the average house price has topped £300k, regional disparities still remain, Halifax finds.
-
 Barings Emerging Europe trust bounces back from Russia woes
Barings Emerging Europe trust has added the Middle East and Africa to its mandate, delivering a strong recovery, says Max King