I have been wrong on gold (so far)
The bulls are getting slaughtered by the plunge in the gold price. John C Burford surveys the charts for a turnaround.
Get the latest financial news, insights and expert analysis from our award-winning MoneyWeek team, to help you understand what really matters when it comes to your finances.
You are now subscribed
Your newsletter sign-up was successful
Want to add more newsletters?

Twice daily
MoneyWeek
Get the latest financial news, insights and expert analysis from our award-winning MoneyWeek team, to help you understand what really matters when it comes to your finances.

Four times a week
Look After My Bills
Sign up to our free money-saving newsletter, filled with the latest news and expert advice to help you find the best tips and deals for managing your bills. Start saving today!
I have a confession: I have been totally wrong on gold in recent weeks. Since the October 19 high of $1,190, gold's decline has been savage, with only six minor up days in the last 32sessions (that has to be a record of sorts).
What has surprised me most was that the July plunge low at $1,070 was taken out with Friday's low print of $1,052. I certainly did not expect that but anything is possible in markets.
I fully expected that the very crowded short trade and my Elliott wave labels would provide the support necessary for the decline to be turned back before now. I got that call very wrong.
MoneyWeek
Subscribe to MoneyWeek today and get your first six magazine issues absolutely FREE

Sign up to Money Morning
Don't miss the latest investment and personal finances news, market analysis, plus money-saving tips with our free twice-daily newsletter
Don't miss the latest investment and personal finances news, market analysis, plus money-saving tips with our free twice-daily newsletter
I read many pundits, especially on gold, which is the ultimate sentiment-driven market. In gold, fundamentals seem to have little influence on short-term moves (as in today's stockmarkets, incidentally).
For a well-considered bearish view of someone who has called it correctly so far, I refer you to Doug Eberhardt's recent articleon Seeking Alpha.
Commercials and small speculators are heavily short gold
Because this is a very crowded trade, I am keeping a beady eye on the weekly COT (commitments of traders) data every Friday. In the week when gold moved down from $1,090 to $1,065, money managers had swung to the short side by a whopping 20%. At the same time, the small speculators had placed so many additional short bets that they were in the highly unusual position of being net short:
| (Contracts of 100 troy ounces) | Row 0 - Cell 1 | Row 0 - Cell 2 | Row 0 - Cell 3 | Open interest: 656,475 | ||||
| Commitments | ||||||||
| 165,084 | 136,121 | 177,177 | 270,123 | 294,588 | 612,384 | 607,886 | 44,091 | 48,589 |
| Changes from 11/10/15 (Change in open interest: 16,965) | ||||||||
| -2,148 | 33,666 | -3,744 | 23,406 | -21,481 | 17,514 | 8,440 | -549 | 8,525 |
| Percent of open in terest for each category of traders | ||||||||
| 25.1 | 20.7 | 27.0 | 41.1 | 44.9 | 93.3 | 92.6 | 6.7 | 7.4 |
| Number of traders in each category (Total traders: 372) | ||||||||
| 143 | 155 | 148 | 56 | 55 | 283 | 282 | Row 8 - Cell 7 | Row 8 - Cell 8 |
That means that in order to force the price down by a modest $25 in the week, the speculators needed to use extreme fire-power. And since last Tuesday when the latest data were compiled the market has dropped even further, no doubt encouraging the speculators to add even more to their short bets (while the smart-money commercials do the opposite).
Not only that, but the DSI (Daily Sentiment Index) has been running in single figures for some time, which is an extreme from where rallies have been mounted in the past.
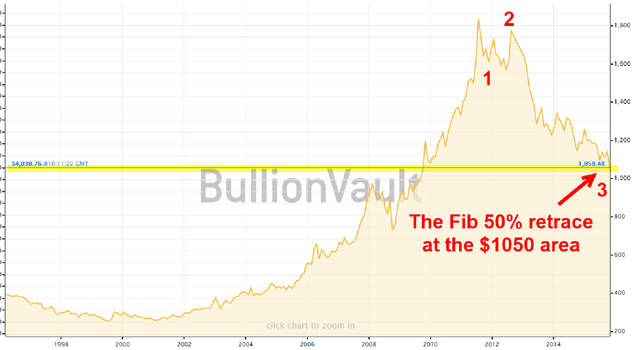
To put this decline into perspective, here is a 20-year chart:

Last week's low near the $1,050 level is a Fibonacci 50% retrace of the entire 2000 2011 bull market. And we know what that means the market has now entered a potentially massive area of support.
I have valid Elliott wave labels drawn where the decline off the October 2011 all-time high can be counted as waves 1, 2 and 3 of a five down (it could also be just as well be counted as an A-B-C down to a very large wave A low leading to a large B wave up). But either interpretation leads to a similar conclusion: either a wave 4 up or a B wave up lies ahead.
There's an ominous pattern in gold and it's shared by the FTSE
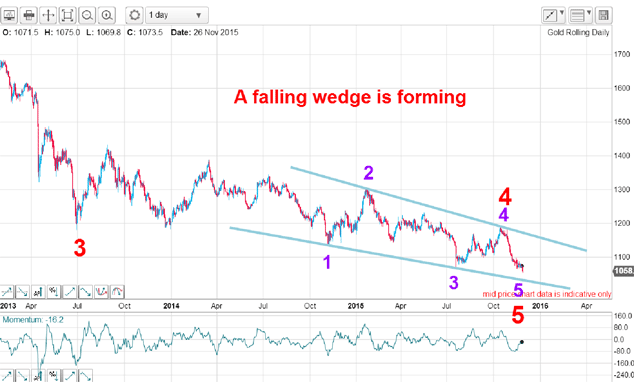
Large red wave 4 is highly complex and is open to a variety of Elliott wave interpretations. But the overall picture is quite clear: the July 2013 plunge low is wave 3, the October 2015 high is wave 4 and we are now in the final wave 5 down.
But the overall pattern being formed is a classic declining wedge. This is the same pattern that is forming in the EUR/USD hourly chart I showed on Friday. And with sentiment in the euro off-the-scale bearish (a mirror-image of that in gold), the stars seem to be lining up in both markets.

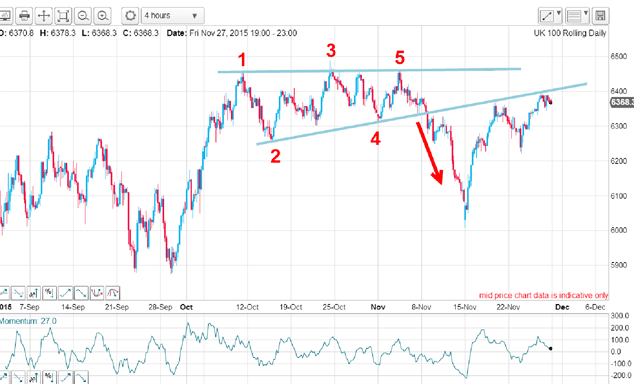
Ominously, I am seeing several ending wedge patterns in some related markets. There's a very powerful reversal pattern underway in the FTSE, composed of the characteristic five sub-waves. When the fifth sub-wave was put in, that was the signal to expect a reversal; the market breaking through the lower wedge line was the confirmation a big correction lay ahead. I have explained how I played that FTSE swing in recent posts:

In gold, a move down to the lower wedge line in the $1,000 region is certainly possible.
But when the market turns back up, the move should be historic as the massed ranks of shorts are squeezed and this should occur at roughly the same time as a rally in the euro (see last Friday's post).
And in December, both the US Federal Reserve are expected to start raising the Fed Funds rate and also the European Central Bank is expected to announce an increase in its quantitative easing (QE) and negative interest rate policy (Nirp) programme. Which means things should get very exciting before Christmas.
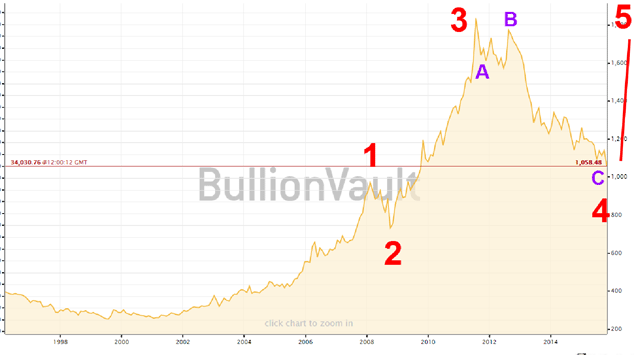
So let me play a little game of conjecture. If I look at the 20-year chart and the decline off the $1,911 October 2011 high is really a large A-B-C, this is a possible scenario I see:

To make this a valid count, wave 5 must start pretty soon. The simple reason is that wave 3 is never the shortest wave of a motive five wave pattern. Wave 3 lasted about thirty months, so wave 5 must be shorter. If it gets going in the next month or so, wave 5 should terminate before mid-2018.
And how high could wave 5 reach? Of course, it would exceed the wave 3 high at $1,920. I have seen a few brave souls calling for $2,500 (although I do not know what methods they used). My feeling is that when the current deflationary period turns around, a tsunami of inflation will kick in (to exceed even that in the 1970s) and we may see gold exceed $3,000 and silver above its all-time high of $50.
Of course, this not my firm prediction only one of several options.
In the meantime, though, the gold bulls are getting slaughtered as the great pendulum of sentiment swings massively in favour of the bears.
Get the latest financial news, insights and expert analysis from our award-winning MoneyWeek team, to help you understand what really matters when it comes to your finances.
John is is a British-born lapsed PhD physicist, who previously worked for Nasa on the Mars exploration team. He is a former commodity trading advisor with the US Commodities Futures Trading Commission, and worked in a boutique futures house in California in the 1980s.
He was a partner in one of the first futures newsletter advisory services, based in Washington DC, specialising in pork bellies and currencies. John is primarily a chart-reading trader, having cut his trading teeth in the days before PCs.
As well as his work in the financial world, he has launched, run and sold several 'real' businesses producing 'real' products.
-
 Average UK house price reaches £300,000 for first time, Halifax says
While the average house price has topped £300k, regional disparities still remain, Halifax finds.
-
 Barings Emerging Europe trust bounces back from Russia woes
Barings Emerging Europe trust has added the Middle East and Africa to its mandate, delivering a strong recovery, says Max King