How to find profitable trades after the big market slide
When it comes to making profits, knowing which way the market will turn is only half the battle - you have to get your timing right too. John C Burford explains his trading methods to help you do just that.
Get the latest financial news, insights and expert analysis from our award-winning MoneyWeek team, to help you understand what really matters when it comes to your finances.
You are now subscribed
Your newsletter sign-up was successful
Want to add more newsletters?

Twice daily
MoneyWeek
Get the latest financial news, insights and expert analysis from our award-winning MoneyWeek team, to help you understand what really matters when it comes to your finances.

Four times a week
Look After My Bills
Sign up to our free money-saving newsletter, filled with the latest news and expert advice to help you find the best tips and deals for managing your bills. Start saving today!
So it begins. The Fed intends to gradually wind down quantitative easing (QE) sooner rather than later. At long last the markets are faced with reality!
Today I want to show you a few charts that illustrate how I use tramlines and Fibonacci levels when markets put in clear pivot points, as they seem to have done on Wednesday.
By identifying likely support zones, you can avoid the un-disciplined urge to see a market in freefall and then just jump in (with a short sale) regardless, and hope for the best.
MoneyWeek
Subscribe to MoneyWeek today and get your first six magazine issues absolutely FREE

Sign up to Money Morning
Don't miss the latest investment and personal finances news, market analysis, plus money-saving tips with our free twice-daily newsletter
Don't miss the latest investment and personal finances news, market analysis, plus money-saving tips with our free twice-daily newsletter
Many traders do just this usually just before a counter-trend bounce starts, which can take them out on their protective stop.
The tough trading game
The only time you make money is to be right on direction and right on timing. It's a tough game. And that is what my style of trading attempts to achieve.
The other factor in having a winning trade is to exit at a good profit. This is the most difficult aspect of trading.
I confess I have some expertise in randomly jumping into a trade my very first futures trade was a loser in exactly this way.
So, if you are trading only those situations that offer a low risk, then the best policy is to wait for a rebound rally, and then go short. You can then place your protective stop quite close.
This is the ideal situation. However, there are times when rallies in a bear market are brief and shallow, so waiting for a decent spot to enter can be frustrating.
But all traders need to know that there will be many other buses coming along, and more opportunities to enter low-risk trades.
OK, let's see how my main markets have fared in the past couple of days:
Dow
The 1/3 and 2/3 levels are sometimes great places to look for turning points. These levels do not appear on my trading platform I have to put them in by hand.
And here is the updated daily chart I have frequently shown:
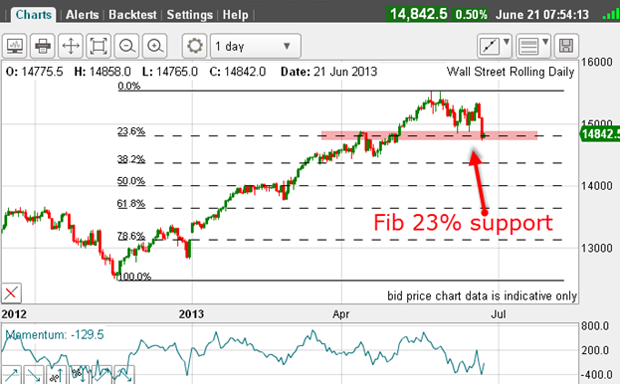
Taking the November major low as my low pivot point, the decline yesterday has taken it to the exact Fibonacci 23% retrace. Nice hit. This morning, the market has started a bounce from this level.
But the form of the decline since the 22 May top is textbook:
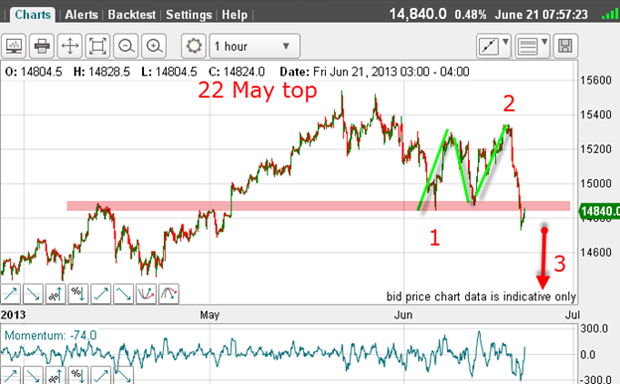
The rally from my wave 1 low to the 19 May high has a classic A-B-C form (green bars), and now the shelf of support (pink bar) has given way.
This support should now act as resistance. The trend is now down. And if my Elliott wave labels are correct, wave 3 should go on for a long long time.
Euro
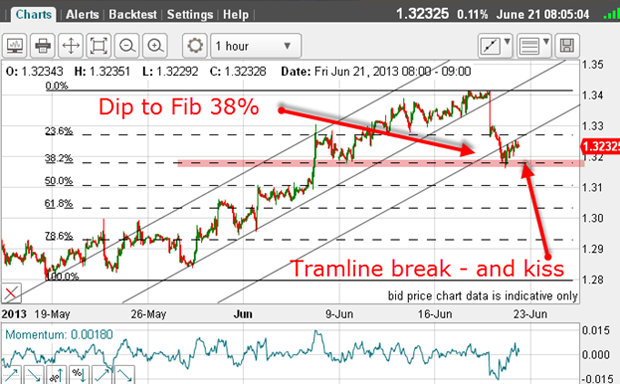
I have drawn in my working tramlines, and right away, the market has broken below the lower line and has hit the Fibonacci 38% retrace of the swing from the 18 May low to the recent high.
This is a point where bounces like to start, and so it is proving.
This morning the market has rallied back to the underside of the line and is making a kiss. Will we see a scalded-cat bounce down in a large wave 3?
USD/JPY
Coming off the rally high near 104 last month, the market had dipped to the 94 area this month. That is a major correction, and sentiment had turned against the dollar and for the yen. But this week, with the 94 level as my new pivot point, I can put in the Fibonacci levels:
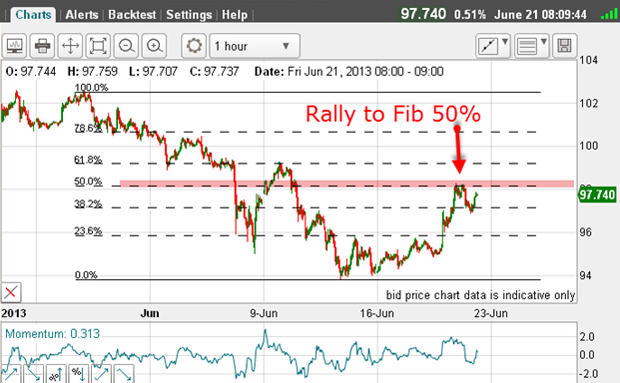
And yesterday, the rally has carried to an exact Fibonacci 50% of this decline. That was a great place to take some profits off the table, since I was long.
But I can draw in a good set of tramlines with the market having broken up past the centre line.
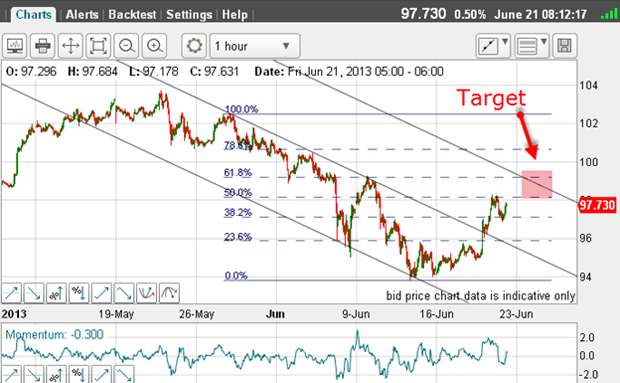
There is the possibility the market will come back and kiss this line, so, this would be a good place to look at a long trade.
My next target is in the pink zone at the upper tramline. Higher potential exists, since the market has a huge short spec interest and this needs to be squeezed before any meaningful decline can occur. The shorts are on the run.
AUD/USD
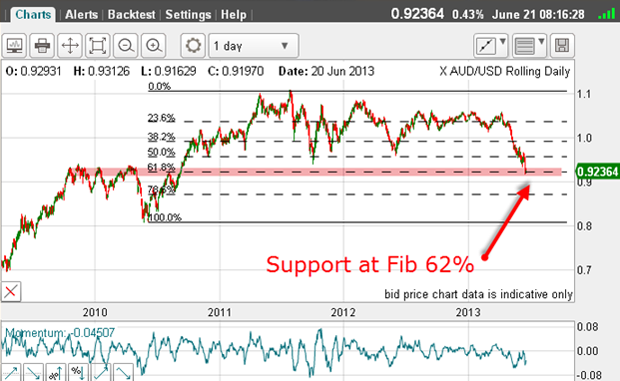
I have taken the low pivot point at the major May 2010 low. A re-bound should start from here (markets have long memories, unlike many investors).
Also, if you squint closely, a potential positive-momentum divergence is in progress. To negate it, the market would have to plunge forcefully from here a slightly more unlikely scenario than a bounce, but certainly not out of the question.
Gold
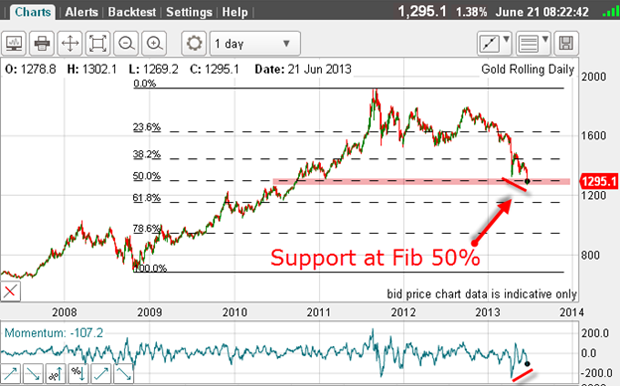
We have seen some major declines in recent days and sentiment has turned extremely bearish (the latest commitments of traders (COT) data is out later today).
But the decline has taken the market to a Fibonacci 50% of the retrace from the major low in late 2008 to the 2011 high. And there is a potential positive-momentum divergence in play (red bars).
My reading is this: the market is due a major rally from current levels. My belief in a counter-trend rally back to the $1,500 area has been thwarted so far. But there is still time!
The past couple of days have offered so many examples of how to use Fibonacci and tramline methods to identify likely support zones these are areas to avoid if trading with the trend, unless you are able to set protective stops very wide.
And the Fibonacci levels and tramlines are also great tools to help identify exit points for your profitable trades.
Get the latest financial news, insights and expert analysis from our award-winning MoneyWeek team, to help you understand what really matters when it comes to your finances.
John is is a British-born lapsed PhD physicist, who previously worked for Nasa on the Mars exploration team. He is a former commodity trading advisor with the US Commodities Futures Trading Commission, and worked in a boutique futures house in California in the 1980s.
He was a partner in one of the first futures newsletter advisory services, based in Washington DC, specialising in pork bellies and currencies. John is primarily a chart-reading trader, having cut his trading teeth in the days before PCs.
As well as his work in the financial world, he has launched, run and sold several 'real' businesses producing 'real' products.
-
 MoneyWeek news quiz: Can you get smart meter compensation?
Smart meter compensation rules, Premium Bonds winners, and the Bank of England’s latest base rate decision all made the news this week. How closely were you following it?
-
 Adventures in Saudi Arabia
Travel The kingdom of Saudi Arabia in the Middle East is rich in undiscovered natural beauty. Get there before everybody else does, says Merryn Somerset Webb