How to trade the battered pound
With so many traders falling over themselves to short the pound, John C Burford smells a rally. Here, he explains how to play the market turn.
Get the latest financial news, insights and expert analysis from our award-winning MoneyWeek team, to help you understand what really matters when it comes to your finances.
You are now subscribed
Your newsletter sign-up was successful
Want to add more newsletters?

Twice daily
MoneyWeek
Get the latest financial news, insights and expert analysis from our award-winning MoneyWeek team, to help you understand what really matters when it comes to your finances.

Four times a week
Look After My Bills
Sign up to our free money-saving newsletter, filled with the latest news and expert advice to help you find the best tips and deals for managing your bills. Start saving today!
Once in a while, I go off-piste to cover a market that is not one of my usual suspects. And today, the GBP/USD rate is offering a superb lesson in one of my major themes picking turning points at sentiment extremes.
In recent weeks, the poor old pound has lost a lot of value against the major currencies. The bloodbath is all over the mainstream press. I'm sure you'll have seen the headlines.
But as we all know, trends do not last forever. And one of my specialities is in forecasting a turn. Let's see if the market is offering any clues if the turn is at hand.
MoneyWeek
Subscribe to MoneyWeek today and get your first six magazine issues absolutely FREE

Sign up to Money Morning
Don't miss the latest investment and personal finances news, market analysis, plus money-saving tips with our free twice-daily newsletter
Don't miss the latest investment and personal finances news, market analysis, plus money-saving tips with our free twice-daily newsletter
Clue number one
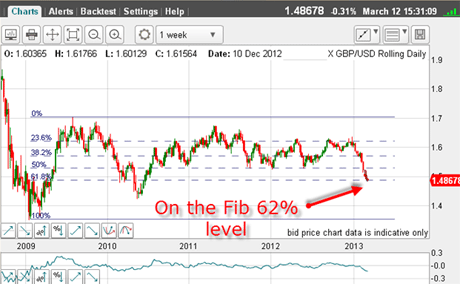
When researching a market that I have not put on my daily radar screen, I like to go first to the very long-term weekly chart. Here it is:

(Click on the chart for a larger version)
It shows the huge dip in 2009 note that the lows occurred almost exactly four years ago and the subsequent wide trading range since.
I mention the four-year span, since many believe there is a four-year cycle operating in markets.
So a four-year span has some history and may be relevant here. It is something to keep in mind.
So after the plunge from the 2 January 1.63 high to the low this week at the 1.48 level which occurred in a virtual straight line the market has arrived at the exact 62% Fibonacci retrace.
This is usually an area offering solid support. That is my first clue for a turn.
Clue number two
Then, after such a collapse in just two months, I like to go to the Commitmentsof Traders(COT) data for a reading of market sentiment. Remember, this data gives a weekly accurate snapshot of where traders are putting their money. It differs from sentiment surveys in that such surveys can contain a healthy dose of kidology a person can tell the pollster anything!
But of course, sentiment surveys have their place especially at extremes. And there are few better indicators of public sentiment than my headline indicator, which I mentioned last time and which I believe is in full operation now.
Here is the latest COT data as of 5 March:
| OPEN INTEREST: 236,181 | ||||||||
| COMMITMENTS | ||||||||
| 36,021 | 79,870 | 4,660 | 178,904 | 97,356 | 219,585 | 181,886 | 16,596 | 54,181 |
| CHANGES FROM 02/26/13(CHANGE IN OPEN INTEREST: 30,998) | ||||||||
| 4,895 | 12,614 | 2,871 | 23,826 | 7,974 | 31,592 | 23,459 | -594 | 7,539 |
| PERCENT OF OPEN INTEREST FOR EACH CATEGORY OF TRADERS | ||||||||
| 15.3 | 33.8 | 2.0 | 75.7 | 41.2 | 93.0 | 77.0 | 7.0 | 23.0 |
| NUMBER OF TRADERS IN EACH CATEGORY (TOTAL TRADERS: 115) | ||||||||
| 21 | 46 | 9 | 32 | 34 | 58 | 84 | Row 8 - Cell 7 | Row 8 - Cell 8 |
This is terrific! It demonstrates that the specs are heavily short, as would be expected in a severe downturn amid the gloomy headlines.
But the most valuable point is that during a week that saw a bear trend, specs of all stripes massively increased their short positions.
The question is now: is the bear side of the boat in danger of capsizing it?
That is my background scenario specs are heavily to the bear side, and the market has hit long-term support. This is an ideal scenario to start looking for a turn.
Clue number three
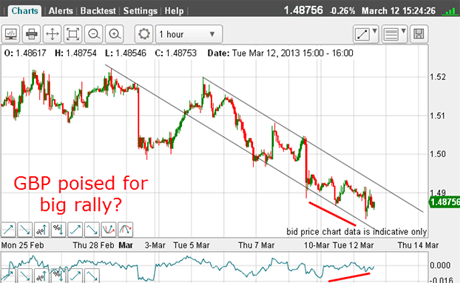
So now I like to zero in on the hourly chart, which covers a few days:
This is the chart I took yesterday:

(Click on the chart for a larger version)
Right away, I can draw in a good pair of tramlines. There are a few pigtails, but, like gold, the GBP/USD suffers from this spikiness.
But the crucial point is that there is a potential large positive-momentum divergence at the low (red bars). I like to see this if I am trying to pick a contrary trade.
The general rule is: the larger the divergence, the bigger the pop!
How to play this?
Now I have some excellent reasons to suspect a turn, I could take one of two actions.
I could take a long trade at the market here and enter a close protective stop just under the low. Or, I could wait until the market breaks above the upper tramline for confirmation of the turn. Here, I would need to set a wider stop.
If the latter, you would set a resting buy order so that if the market hits your price while you are sound asleep, your order would be filled.
The choice comes down to balancing the risks. If you are a more adventurous trader, you would take the first trade. If a by-the-book type, you would opt for the second. It is horses for courses.
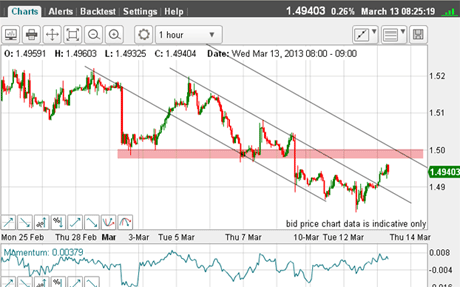
Here is the situation this morning:

(Click on the chart for a larger version)
Overnight, we have the satisfactory tramline break and both sets of traders are now long.
I have drawn my third higher tramline and this becomes my first target, which also meets the chart resistance shown in pink.
If and when the market hits this target, traders have another decision take profits or stay with the trade?
When deciding to trade the markets, it is a good idea to have a firm idea of what time-scale you wish to operate in.
If more a day-trader type, where you use hit-and-run tactics, then you will be looking to get out soon.
But for swing trading, where you hope to catch moves of several cents, these traders will be looking for a bigger pop over several days. And if the market advances further, you would move your protective stop to break-even for a no-risk trade.
Swing traders would be looking for a higher target, but where?
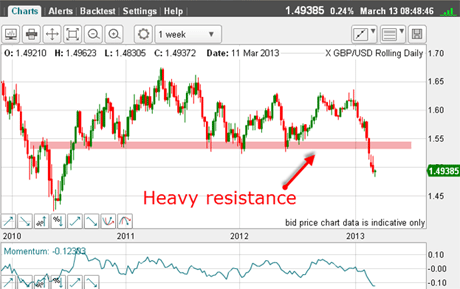
If we go back to the weekly chart, you will see that there is very solid resistance in the 1.53 1.54 area (pink zone):

(Click on the chart for a larger version)
If I were still with the long trade here, that would be a great place to look to take profits of around 600 pips and all from the simple analysis that I have described.
If you're a new reader, or need a reminder about some of the methods I refer to in my trades, then do have a look at my introductory videos:
The essentials of tramline trading
An introduction to Elliott wave theory
Advanced trading with Elliott waves
Don't miss my next trading insight. To receive all my spread betting blog posts by email, as soon as I've written them, just sign up here . If you have any queries regarding MoneyWeek Trader, please contact us here.
Get the latest financial news, insights and expert analysis from our award-winning MoneyWeek team, to help you understand what really matters when it comes to your finances.
John is is a British-born lapsed PhD physicist, who previously worked for Nasa on the Mars exploration team. He is a former commodity trading advisor with the US Commodities Futures Trading Commission, and worked in a boutique futures house in California in the 1980s.
He was a partner in one of the first futures newsletter advisory services, based in Washington DC, specialising in pork bellies and currencies. John is primarily a chart-reading trader, having cut his trading teeth in the days before PCs.
As well as his work in the financial world, he has launched, run and sold several 'real' businesses producing 'real' products.
-
 MoneyWeek Talks: The funds to choose in 2026
Podcast Fidelity's Tom Stevenson reveals his top three funds for 2026 for your ISA or self-invested personal pension
-
 Three companies with deep economic moats to buy now
Opinion An economic moat can underpin a company's future returns. Here, Imran Sattar, portfolio manager at Edinburgh Investment Trust, selects three stocks to buy now