How to survive when a trade goes against you
Even the most experienced traders don't win every trade, says John C Burford. That is why you must always manage your risk.
Get the latest financial news, insights and expert analysis from our award-winning MoneyWeek team, to help you understand what really matters when it comes to your finances.
You are now subscribed
Your newsletter sign-up was successful
Want to add more newsletters?

Twice daily
MoneyWeek
Get the latest financial news, insights and expert analysis from our award-winning MoneyWeek team, to help you understand what really matters when it comes to your finances.

Four times a week
Look After My Bills
Sign up to our free money-saving newsletter, filled with the latest news and expert advice to help you find the best tips and deals for managing your bills. Start saving today!
In recent posts, I have offered my analysis of trades that went well and produced significant swing profits at low risk. Of course, not all of my trades go so well and today, I will cover how I handle trades that do not follow the script.
It is a fact that many very successful professional traders have more losing trades than winning ones. But good traders cut losses short on the losers and achieve high returns on the winners.
And how do they cut losses short? Simply by employing strict money management rules on all trades. Before entering a trade, I always evaluate the price level at which I am willing to admit I am wrong. I can then set my stop loss level accordingly. I use my 3% rule and my break-even rule.
MoneyWeek
Subscribe to MoneyWeek today and get your first six magazine issues absolutely FREE

Sign up to Money Morning
Don't miss the latest investment and personal finances news, market analysis, plus money-saving tips with our free twice-daily newsletter
Don't miss the latest investment and personal finances news, market analysis, plus money-saving tips with our free twice-daily newsletter
Let me give you an example. I covered the FTSE on Monday ("The FTSE decline has finally begun"),where my analysis strongly suggested that the next big move would be down.
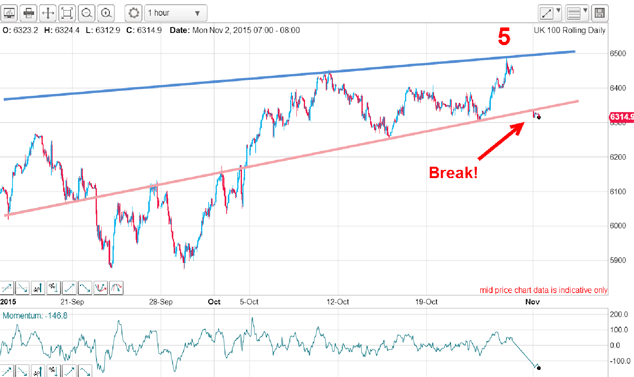
On the hourly chart below, the upper blue line is the multi-year trendline drawn off the 2009 low. I regarded that as a highly reliable line of support and resistance. My waves 3 and 5 had bounced off that line in what I term a kiss. Having completed five waves up, it appeared the line would hold and the next move would be a break of the lower pink line of support. Normally, a scalded-cat bounce follows a kiss and I was looking forward to a sharp decline.
On Monday morning, that break occurred. A short trade at that level was fully justified based on my analysis:

I then entered a short trade at the 6,350 level and placed my stop loss just above the line at 6,375 for a 25-pip risk. This was a low-risk trade and I was prepared to take that loss if it failed.
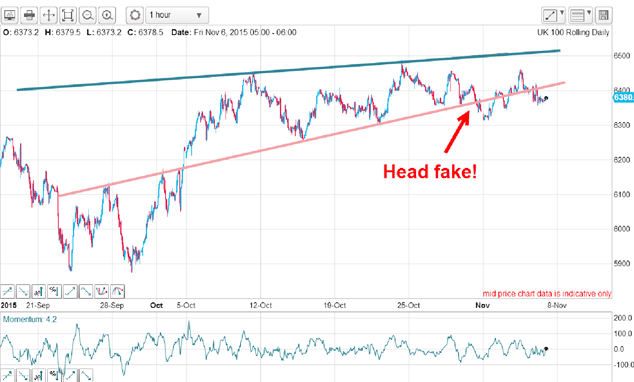
Was it off to the races now? For a while, it was. The market declined to the 6,320 level, but then turned around and moved back above the pink line.
That reversal is what I term a head fake and they are nasty beasts! So, from a very promising position, the trade turned sour and my stop loss was hit for a 25-pip loss. The odds were well in my favour at the start, but even 100-1 outsiders win races sometimes.

If I was presented with an identical setup in 100markets, I can be assured that it would work more than half of the time and I would take all of the trades.
So where does that leave my analysis? The pink line has been destroyed as a reliable line of support/resistance and I must now abandon it. What could possibly take its place?
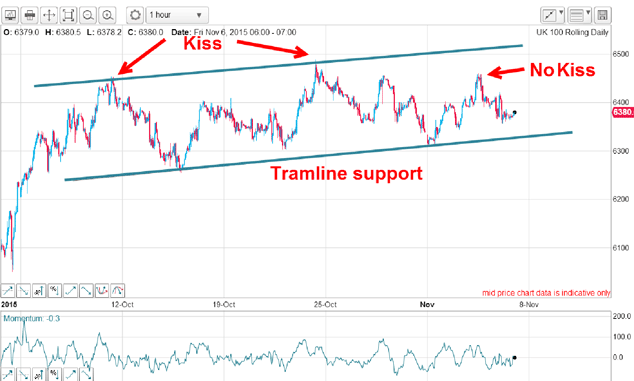
If I draw a parallel tramline off my upper blue line, what do I see? Well, the new line passes right through the two major lows. Isn't that pretty? While I was busy with my pink line, the market was really working the blue tramline pair!

If I was really smart, I would have noted that earlier and drawn in the lower tramline before the market hit it late on Monday. But of course, I had very few touch points to work with. Sometimes traders have to work with very limited information.
Note that the recent high came nowhere near to kissing the line again for a third time. I find that it is very rare to see three kisses.
But now, I have a reliable lower tramline to work with. And I have a potential new trade setup. If the market declines to it and breaks below it, that will be my sell signal. And I will employ the same risk management considerations to set my stop loss.
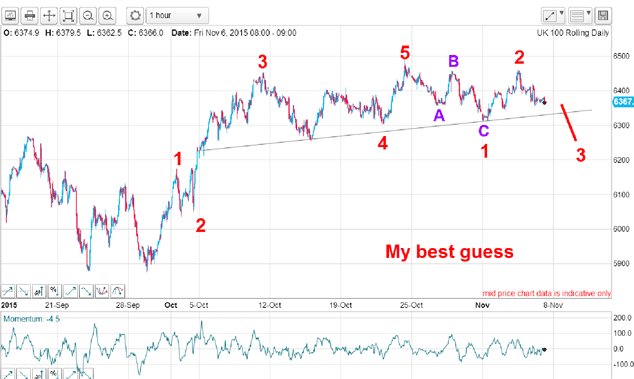
Has the head fake negated my original wave analysis? Here is the chart again:

In fact, my wave 5 high remains untested and the waves down are as shown. If the lower tramline is broken, odds will swing heavily to a wave 3 interpretation. But if the line holds, a more complex pattern will emerge and possibly lead to new highs.
So, that lower tramline is my new line in the sand.
Get the latest financial news, insights and expert analysis from our award-winning MoneyWeek team, to help you understand what really matters when it comes to your finances.
John is is a British-born lapsed PhD physicist, who previously worked for Nasa on the Mars exploration team. He is a former commodity trading advisor with the US Commodities Futures Trading Commission, and worked in a boutique futures house in California in the 1980s.
He was a partner in one of the first futures newsletter advisory services, based in Washington DC, specialising in pork bellies and currencies. John is primarily a chart-reading trader, having cut his trading teeth in the days before PCs.
As well as his work in the financial world, he has launched, run and sold several 'real' businesses producing 'real' products.
-
 UK interest rates live: rates held at 3.75%
The Bank of England’s Monetary Policy Committee (MPC) met today to decide UK interest rates, and voted to hold rates at their current level
-
 MoneyWeek Talks: The funds to choose in 2026
Podcast Fidelity's Tom Stevenson reveals his top three funds for 2026 for your ISA or self-invested personal pension