How to set price targets using a third tramline
Adding third tramlines to your charts can be a great way to set price targets. John C Burford shows how it's done in the euro market.
Get the latest financial news, insights and expert analysis from our award-winning MoneyWeek team, to help you understand what really matters when it comes to your finances.
You are now subscribed
Your newsletter sign-up was successful
Want to add more newsletters?

Twice daily
MoneyWeek
Get the latest financial news, insights and expert analysis from our award-winning MoneyWeek team, to help you understand what really matters when it comes to your finances.

Four times a week
Look After My Bills
Sign up to our free money-saving newsletter, filled with the latest news and expert advice to help you find the best tips and deals for managing your bills. Start saving today!
Today, I want to show you an interesting setup in the EUR/USD that illustrates how drawing in the third tramline can be invaluable in setting price targets.
On 11 August, I asked the question: Is the euro ready for a rally? This was the hourly chart then:
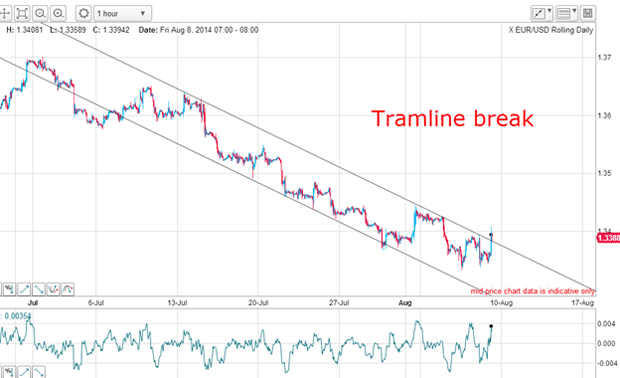
I then combined the tramline break on this hourly chart with the longer-term daily chart:
MoneyWeek
Subscribe to MoneyWeek today and get your first six magazine issues absolutely FREE

Sign up to Money Morning
Don't miss the latest investment and personal finances news, market analysis, plus money-saving tips with our free twice-daily newsletter
Don't miss the latest investment and personal finances news, market analysis, plus money-saving tips with our free twice-daily newsletter
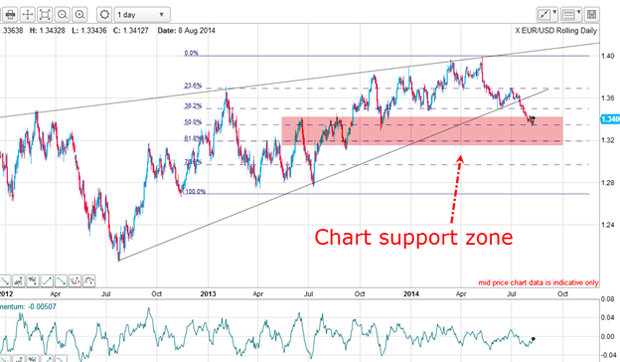
It showed major chart and Fibonacci support, and I concluded that a rally was very likely.
The euro stages a rally but it was weak
The tramline break was the initial signal that a rally was in the offing, and on that break I could draw a third higher tramline. That is always my practice whenever I see a tramline break.The reason is that my new third tramline gives me a likely price target.
So how far did the rally carry? Here is the updated chart:
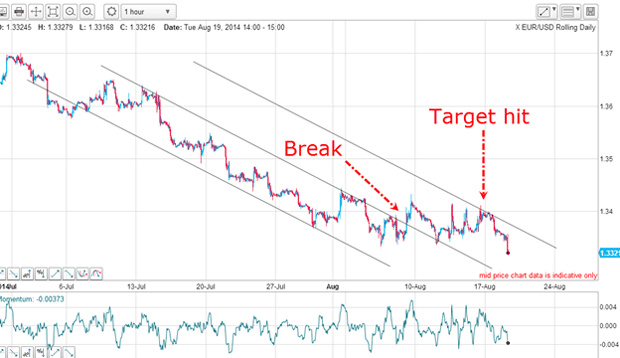
Actually, it didn't carry very far. Although my third tramline target was hit, the high reached was only a handful of pips above entry price. This was because my tramlines have a sharp angle down and it did not take long for the third tramline to decline to the region of the entry price.
How to find a new target
Let's take a step back and look at the daily chart:
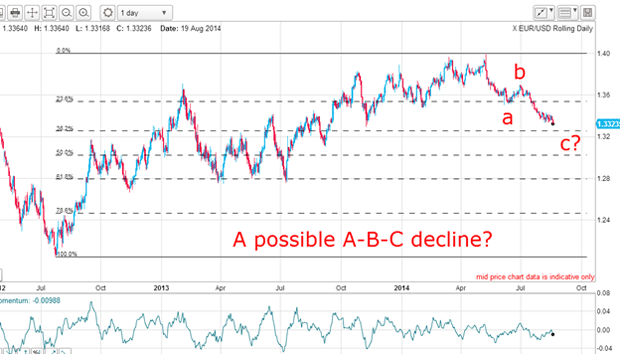
From the 1.40 high, the pattern has a distinct three-wave feel to it (so far) in a possible a-b-c. The next Fibonacci support lies just below the current market in the 1.3250 area. That is one possible target.
Also, we often see wave equality between waves a and c. That would place wave c low at the 1.32 area.
But let's look at my c wave in close-up:
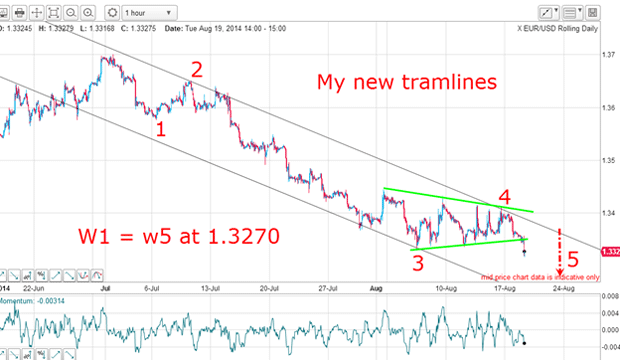
I have a lovely five-wave impulsive pattern. The new low yesterday has confirmed the pattern. I can also draw in new tramlines.
My waves 1, 2 and 3 are textbook waves with wave 3 containing its own clear five sub-wave pattern. My wave 4 is complex, as is usual, and now we are in the final fifth wave down.
The complex wave 4 is interesting and forms a wedge, which is a typical pattern for a fourth wave. The 1.34 1.3450 area was solid resistance and every time the market tried to break free, it was hit by heavy selling. And just like a coiled spring, the move out of the wedge is sharp.
That is one thing you can reasonably forecast when you see a wedge and that is why it is one of my favourite patterns. A trade in the direction of the breakout will usually be in profit from the get-go. I like those trades!
The equality of waves 1 and 5 gives me another target
But there is also another wave equality rule I can apply here: the equality of waves 1 and 5. That would place the target at the 1.3270 area. Of course, the fifth wave could extend, but as a minimum the 1.3270 level appears valid.
I now have five downside targets from several different methods:
Wave 1 = wave 5 of c wave: 1.3270 Fibonacci 50% support: 1.3250 Centre tramline on hourly: 1.3250
Wave a = wave c on hourly: 1.32 Lower tramline on hourly: 1.32
They all lie between 1.3270 and 1.32, making that a prime target area.
Of course, we could really be in a large third wave of an impulsive five-wave pattern off the 1.40 high, not an a-b-c. If so, the downside target for wave 3 lies much lower than 1.32.
Further market development will help answer than question. But at least I have some firm targets where I can consider taking at least partical profits using my split-bet strategy.
What the sentiment data tells us
That tells me that when the fifth wave completes, I should expect a decent relief rally (in perhaps an A-B-C pattern).
For short-term trades, the 1.32 region appears a sensible place to take at least partial profits.
Get the latest financial news, insights and expert analysis from our award-winning MoneyWeek team, to help you understand what really matters when it comes to your finances.
John is is a British-born lapsed PhD physicist, who previously worked for Nasa on the Mars exploration team. He is a former commodity trading advisor with the US Commodities Futures Trading Commission, and worked in a boutique futures house in California in the 1980s.
He was a partner in one of the first futures newsletter advisory services, based in Washington DC, specialising in pork bellies and currencies. John is primarily a chart-reading trader, having cut his trading teeth in the days before PCs.
As well as his work in the financial world, he has launched, run and sold several 'real' businesses producing 'real' products.
-
 Average UK house price reaches £300,000 for first time, Halifax says
While the average house price has topped £300k, regional disparities still remain, Halifax finds.
-
 Barings Emerging Europe trust bounces back from Russia woes
Barings Emerging Europe trust has added the Middle East and Africa to its mandate, delivering a strong recovery, says Max King