How to find a better tramline
A tramline with no touch points is less than idea, says John C Burford. Here, he explains how to refine your tramline trading if the market suddenly turns.
Get the latest financial news, insights and expert analysis from our award-winning MoneyWeek team, to help you understand what really matters when it comes to your finances.
You are now subscribed
Your newsletter sign-up was successful
Want to add more newsletters?

Twice daily
MoneyWeek
Get the latest financial news, insights and expert analysis from our award-winning MoneyWeek team, to help you understand what really matters when it comes to your finances.

Four times a week
Look After My Bills
Sign up to our free money-saving newsletter, filled with the latest news and expert advice to help you find the best tips and deals for managing your bills. Start saving today!
Before I cover the Dow, I want to follow up on Apple, which had its largest ever one-day fall on Wednesday.
I feel validated last week, I argued that the stock was set up for a short sale. But the lesson here is that it was more difficult than usual to find my entry, since placing my central tramline in its precise position was difficult.
As I will show, some flexibility was required (see chart below).
MoneyWeek
Subscribe to MoneyWeek today and get your first six magazine issues absolutely FREE

Sign up to Money Morning
Don't miss the latest investment and personal finances news, market analysis, plus money-saving tips with our free twice-daily newsletter
Don't miss the latest investment and personal finances news, market analysis, plus money-saving tips with our free twice-daily newsletter
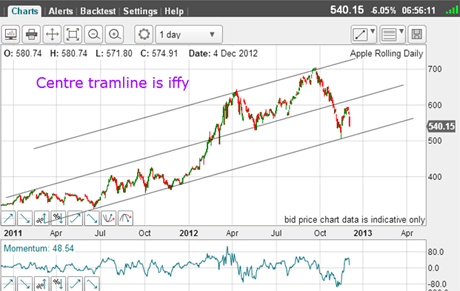
These are my original placements, where the central tramline starts well with the prior pivot point(PPP) back in February 2011, but the three touch points between March and July this year left a lot to be desired. In fact, none of them touch! This is less than ideal.
(Click on the chart for a larger version)
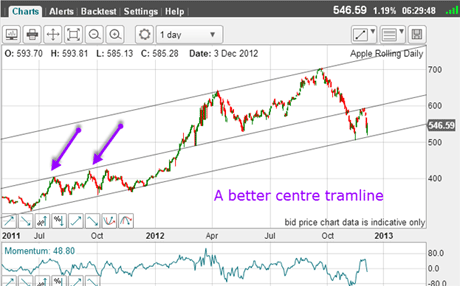
So that was one major warning that the rally off the $505 16 November low was likely to miss this line as well. It was time to look for a better centre tramline and here it is:
(Click on the chart for a larger version)
Now, I have two excellent PPPs (purple arrows) and a direct hit on the March spike low.
Since I was setting up for a short trade following the recent rally and was on the lookout for an entry, my best policy was to get into the trade on this tramline touch. That is especially because momentum was way overbought, and at a level where previous tops were made.
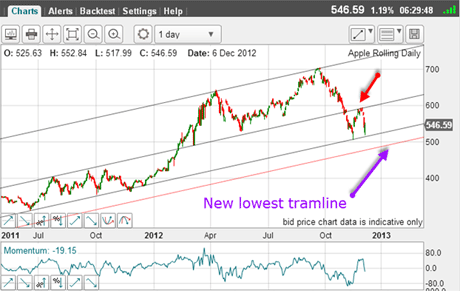
So now the market is heading back to my lowest tramline. But I have a larger gap between my highest and centre lines, which means that I may have to lower my lowest line to make it equidistant, and the target becomes well below $500.
(Click on the chart for a larger version)
Trading summary: short from the $680 level, cover and go long from the $520 level, cover and go short at the $580 level for a cumulative score of 260 pips, or a gain of £260 for each £0.10 bet to date. And I now have my protective stop on my new short trade at break-even. My worst-case is a banked profit of 220 pips.
Isn't this kind of profit with prudent risk management well worth working for?
To achieve it, it will take a dedication to mastering my methods, and, as with everything in life, practice makes perfect. Just decide to master my video tutorials, continue your own studies, and practice strict risk management, and these profits can be yours.
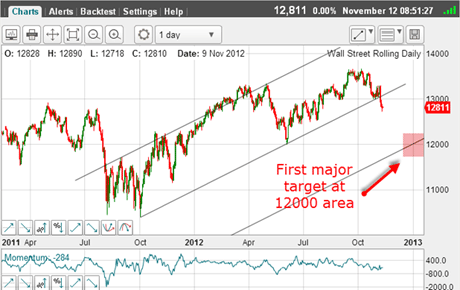
OK, back to the Dow, which is resisting all attempts to turn lower. When I left it on 12 November, the market was moving down off the 13,660 high and had broken a major tramline:
(Click on the chart for a larger version)
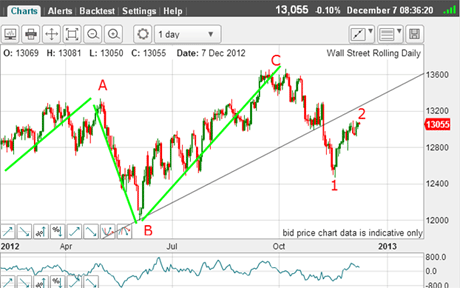
And I had my tentative Elliott wave picture.We were then in wave 1 down and I was looking for that to bottom and start a rally in wave 2.
This is the picture today:
(Click on the chart for a larger version)
I believe I can safely say we now have wave 2 in progress!Wave 1 bottomed just under 12,500 and is currently pushing for the underside of my trend line. The market is following my roadmap, so far.
I am searching for the wave 2 top
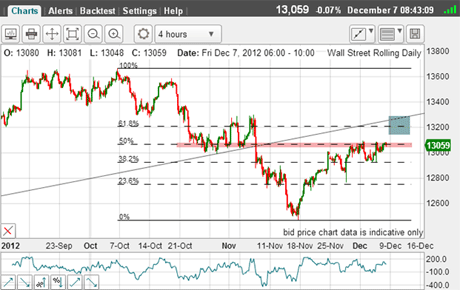
So my strategy now is to look for thetop of wave 2, but can I glean anything from a closer look?
(Click on the chart for a larger version)
Right away, I can say we have reached the Fibonacci 50% retrace eating into overhead resistance (pink bar), and we have a slight A-B-C feel to wave 2 (but not definitive yet).
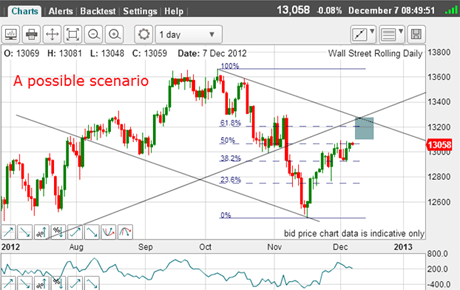
This means to me that a further push up to the blue bar zone is entirely possible:
(Click on the chart for a larger version)
I have drawn in a possible tramline pair, and a push up into the blue zone would take it to the crossing of two tramlines and the Fibonacci 62% retrace. Remember, I have often commented that the Dow has made many deep upward retracements in recent years.
But a failure here and a break of the week's 12,900 low would almost certainly mean that the wave 2 top is in and the market will embark on wave 3 down.
If you're a new reader, or need a reminder about some of the methods I refer to in my trades, then do have a look at my introductory videos:
The essentials of tramline trading
An introduction to Elliott wave theory
Advanced trading with Elliott waves
Don't miss my next trading insight. To receive all my spread betting blog posts by email, as soon as I've written them, just sign up here . If you have any queries regarding MoneyWeek Trader, please contact us here.
Get the latest financial news, insights and expert analysis from our award-winning MoneyWeek team, to help you understand what really matters when it comes to your finances.
John is is a British-born lapsed PhD physicist, who previously worked for Nasa on the Mars exploration team. He is a former commodity trading advisor with the US Commodities Futures Trading Commission, and worked in a boutique futures house in California in the 1980s.
He was a partner in one of the first futures newsletter advisory services, based in Washington DC, specialising in pork bellies and currencies. John is primarily a chart-reading trader, having cut his trading teeth in the days before PCs.
As well as his work in the financial world, he has launched, run and sold several 'real' businesses producing 'real' products.
-
 Can mining stocks deliver golden gains?
With gold and silver prices having outperformed the stock markets last year, mining stocks can be an effective, if volatile, means of gaining exposure
-
 8 ways the ‘sandwich generation’ can protect wealth
People squeezed between caring for ageing parents and adult children or younger grandchildren – known as the ‘sandwich generation’ – are at risk of neglecting their own financial planning. Here’s how to protect yourself and your loved ones’ wealth.