How to assess a market’s potential for profit
Sometimes you'll find a great trading opportunity in an individual stock. John C Burford explains how to tell if it's worth the extra risk.
Get the latest financial news, insights and expert analysis from our award-winning MoneyWeek team, to help you understand what really matters when it comes to your finances.
You are now subscribed
Your newsletter sign-up was successful
Want to add more newsletters?

Twice daily
MoneyWeek
Get the latest financial news, insights and expert analysis from our award-winning MoneyWeek team, to help you understand what really matters when it comes to your finances.

Four times a week
Look After My Bills
Sign up to our free money-saving newsletter, filled with the latest news and expert advice to help you find the best tips and deals for managing your bills. Start saving today!
In my posts, my intention is to show how you can apply my simple tramline-trading methods and money management rules to extract profit from markets.
I concentrate largely on the major markets of the Dow, EUR/USD and gold, because they offer up so many wonderful examples of how to use my tramline methods. Additionally, I focus on only three markets, because I can keep a continuous coverage of one of them in more or less real time.
These three markets are among the very largest, where the number of active participants is huge. The dollar volumes traded are astronomical, and that means they are as free from manipulation as can be imagined.
MoneyWeek
Subscribe to MoneyWeek today and get your first six magazine issues absolutely FREE

Sign up to Money Morning
Don't miss the latest investment and personal finances news, market analysis, plus money-saving tips with our free twice-daily newsletter
Don't miss the latest investment and personal finances news, market analysis, plus money-saving tips with our free twice-daily newsletter
For swing trading, I generally avoid individual stocks, because they contain factors that are not present in stock indexes. In other words, an individual share price can be hit by a sudden departure of a top officer, or a shock profit warning, or a takeover offer.
Any one of these company-specific factors can throw the charts into turmoil and produce nasty spikes and gaps that can give your trade a loss greater than you had planned as the market gaps through your stop-loss.
But once in a while, I see such a compelling chart on an individual equity that it becomes a very interesting proposition. Today, I'm going to tell you about one of these.
Trading individual equities
Alcoa (NYSE: AA)
Incidentally, I will only consider trading an individual equity if it is a very large-cap stock and is a leader in a well-established industry. That means I shun the latest hot biotech issues.
Alcoa is the world's largest producer of aluminium, so that share certainly qualifies.
But here in the UK, a colleague suggested I take a look at Rolls-Royce (LSE: RR). This company is a household name and a leader in its industry (aeroplane engines) and is a very large cap (a component of the FTSE 100). Boxes ticked.
How to analyse a brand new market
Initially, I look at the weekly chart, in order to give me an idea of what trends are operating - and here it is covering the past 20 months:
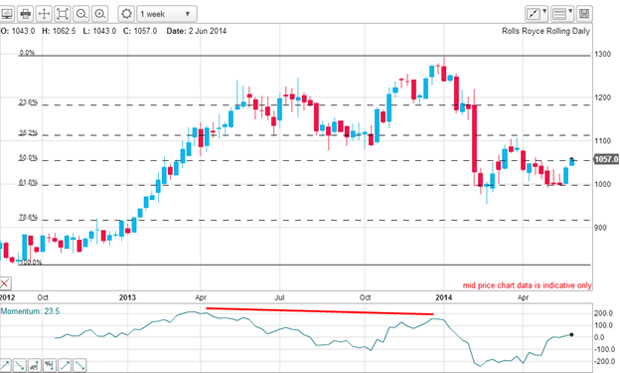
In 2013, the market was in a clear bull phase but when it reached the £12 area in the summer, it ran into a wall and tops were made. A clue that the bull run was having difficulty was the large negative-momentum divergences in the April-July period.
And then late last year, the market spurted higher to the £13 level on a negative-momentum divergence. That was a warning to the bulls, and the market duly fell hard in the January-February period, where it found support at the Fibonacci 62% level in the £10 area.
And since then, the market has been consolidating in the £10 - £11 zone.
What further information can I glean from this chart?
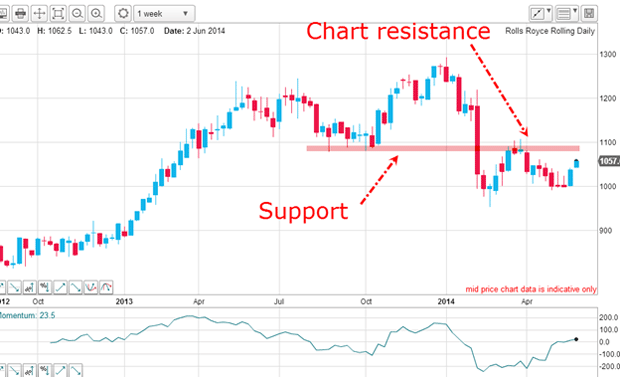
The lows in the £11 area put in last September-October were broken early this year and has now become resistance. This was demonstrated by the March rally being turned back. This is entirely typical behaviour.
In summary: the market is in a long-term bull phase with the recent decline to a typical Fibonacci 62% level. Currently, the market is consolidating this decline but has not entered a bear phase yet. The odds therefore favour a continuation of the rally, and to trade long.
What the daily chart tells us
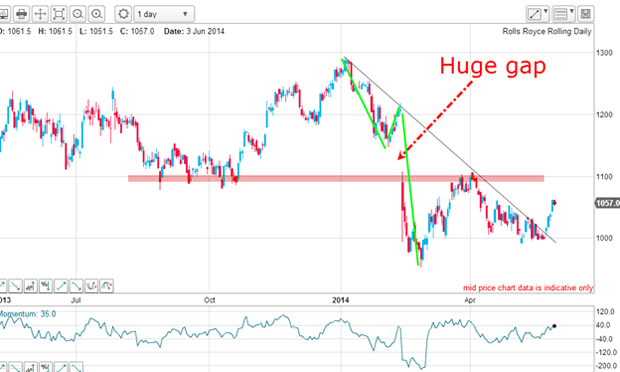
Now on the daily chart, the stand-out feature is the huge gap down on 13 February which took out all the sell-stops under the £11 chart support level. That was an opening gap of around 10% - a massive overnight drop in value for such a large cap share. It was historic.
The chart support at £11 was a very obvious area for traders holding long positions to enter their protective sell-stops and that is why the selling was so intense there.
Was the gap now going to fulfill its usual role of acting as a magnet for prices?
Following the selling exhaustion on oversold momentum at under £10, the market recovered to the edge of the gap at £11 and was turned back by the huge force of resistance there. The magnet was working.
But observe the magnificent trendline I can draw off the minor highs off the January top. It has multiple touch points, making it a very reliable line of resistance.
It was clear then that if the market could break up through this resistance, that would signal a tradable event.
Have I found a tradable event?
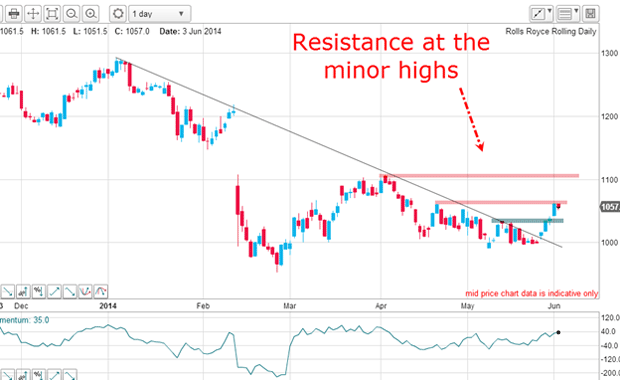
That is a clear break of the trendline and suggests the trend had turned back up. Additional confirmation would come if the minor highs could be taken out.
The first high has already been exceeded and the second is being tested in current trading.
But when the market broke the line on Wednesday, that was the signal to go long. A very close protective stop could then be entered just below recent lows just under £10 for a very low-risk trade.
Looking ahead, the critical level is the £11 area. If the market can break above that, there is every likelihood that the gap can be closed. Why is that? Simply because the bears will have placed their protective buy-stops in the obvious place just above $11!
But this short squeeze effect should be small compared with the stop-loss selling because the short interest in RR is tiny compared with the total capitalisation.
In any event, to keep the rally alive, my resistance levels need to be taken out at some stage.
But with the FTSE in the 6,800 area, which is a seven-year resistance level, RR may have difficulty pressing ahead vigorously in the near term.
Proof that tramline theory works
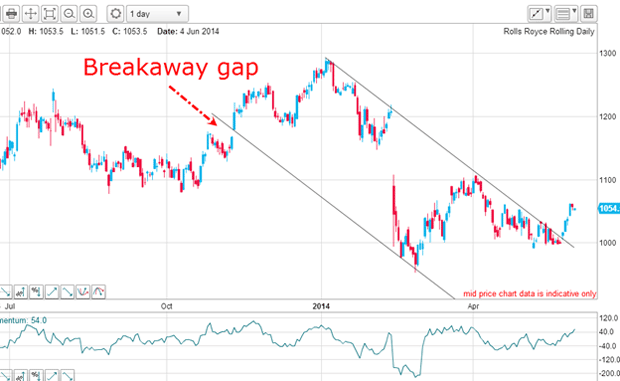
I have drawn in the lower tramline off the trendline and it is superb with the breakaway gap providing the early touch point and the lows touch the line very accurately.
According to tramline theory, the upper tramline is my major target:
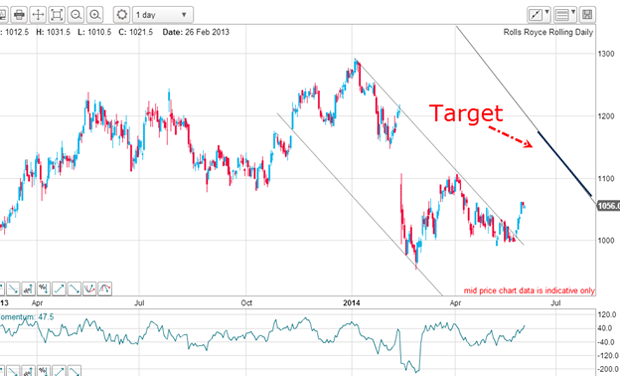
And that places it right at major resistance at the £11 area. What a coincidence!
Of course, if the market sells off, we could see an attempted kiss back on the trendline. This is something to be aware of whenever a trendline is broken.
But for now, the market appears ready to make an assault on that critical £11 level.
I have used tramline and Fibonacci ideas to build this picture. Why not examine a few charts of very high cap shares and see if you can discover a stand-out trade?
Get the latest financial news, insights and expert analysis from our award-winning MoneyWeek team, to help you understand what really matters when it comes to your finances.
John is is a British-born lapsed PhD physicist, who previously worked for Nasa on the Mars exploration team. He is a former commodity trading advisor with the US Commodities Futures Trading Commission, and worked in a boutique futures house in California in the 1980s.
He was a partner in one of the first futures newsletter advisory services, based in Washington DC, specialising in pork bellies and currencies. John is primarily a chart-reading trader, having cut his trading teeth in the days before PCs.
As well as his work in the financial world, he has launched, run and sold several 'real' businesses producing 'real' products.
-
 MoneyWeek news quiz: Can you get smart meter compensation?
Smart meter compensation rules, Premium Bonds winners, and the Bank of England’s latest base rate decision all made the news this week. How closely were you following it?
-
 Adventures in Saudi Arabia
Travel The kingdom of Saudi Arabia in the Middle East is rich in undiscovered natural beauty. Get there before everybody else does, says Merryn Somerset Webb