How much longer can the Dow's rally go on?
The Dow's relief rally has given plenty of opportunities for spread betting trades. But how long will it go on, and how should traders play it? John C Burford examines the charts for clues.
Get the latest financial news, insights and expert analysis from our award-winning MoneyWeek team, to help you understand what really matters when it comes to your finances.
You are now subscribed
Your newsletter sign-up was successful
Want to add more newsletters?

Twice daily
MoneyWeek
Get the latest financial news, insights and expert analysis from our award-winning MoneyWeek team, to help you understand what really matters when it comes to your finances.

Four times a week
Look After My Bills
Sign up to our free money-saving newsletter, filled with the latest news and expert advice to help you find the best tips and deals for managing your bills. Start saving today!
When I left the Dow last week, the market was testing the fourth tramline, and I managed to take a profit out of the short trade from the move down to the 10,600 area.
Since then, the market did shoot up past that fourth tramline.
Because that represented strong resistance and was the meeting place between the Fibonacci 38% level and the fourth tramline, any push past there was going to require a lot of buying. And that is what happened.
MoneyWeek
Subscribe to MoneyWeek today and get your first six magazine issues absolutely FREE

Sign up to Money Morning
Don't miss the latest investment and personal finances news, market analysis, plus money-saving tips with our free twice-daily newsletter
Don't miss the latest investment and personal finances news, market analysis, plus money-saving tips with our free twice-daily newsletter
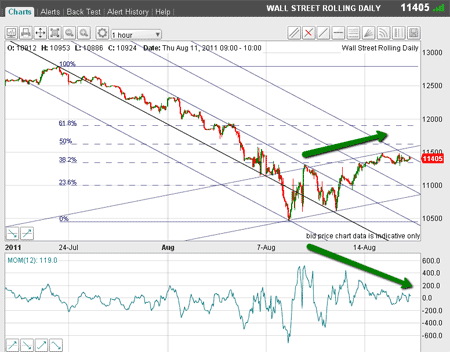
This is the chart this morning.

(Click on the chart for a larger version)
Recall, my Fibonacci levels are using the 12,800 high from July and the 10,450 low.
Trading Tip: It is a simple matter to lay your Fibonacci levels when looking for support and resistance levels. These are the areas where you can expect upcoming market turns very useful information to have!
How tramlines and momentum readings can give you a trading edge
Now with the market moving up, I can draw more tramlines.
Here, I have drawn a fifth, equidistant from all the others. Currently, the market is testing that tramline.
Now, on the way up from the interim 10,600 low, the market punched through my third (original) tramline to the 11,300 area, and then backed off to hit the upside of the third tramline, where it met support and bounced back up.
This was also the exact Fibonacci 50% retrace of the move up from the 10,600 low to the 11,300 high.
Trading Tip: Why not bring up the Dow chart on your screen and admire how this exact Fibonacci level provided solid support. That was a great place to put out a long trade and at reduced risk.
But now the market is trading above the Fibonacci 38% level, but momentum is waning (see the green arrows), and a potential negative momentum divergence is being set up.
I will return to this point later.
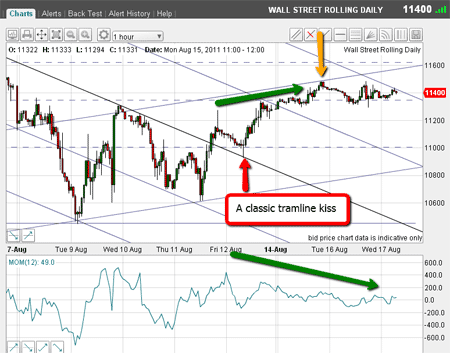
OK, I can now draw a pair of up-sloping tramlines using the 10,450 low of 9 August and the 10,600 low of 11 August.
My second tramline is easy to spot it passes through the 11,300 high of last Tuesday and the previous minor lows of 5-8 August.
That tramline will be very difficult to penetrate, in my opinion.
Here is a close-up chart:

(Click on the chart for a larger version)
The market briefly touched the upper tramline yesterday in the 11,500 area (marked with yellow arrow).
That was a great place to take profits on the previous long trade and initiate a new short trade.
Note the potential negative momentum divergence at the 11,500 level.
Trading Tip: I cannot state this often enough, but always be on the lookout for momentum divergences. I have found that they are extremely reliable signals to warn of a turn ahead. In conjunction with other evidence, you have a definite trading edge!
There may be another bite of the cherry!
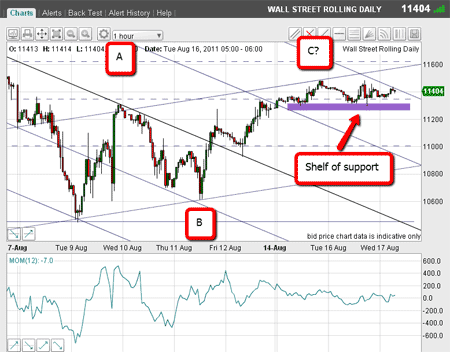
Here is the hourly chart showing my new fifth tramline and the market is bumping up against it as I write.

(Click on the chart for a larger version)
If the market turns here, I could take a short trade again with a low risk. My protective stop could be just above the tramline.
And a turn would likely be confirmed if the market can move below the shelf of support (marked with purple bar).
If so, my first target then is the fourth tramline in the 10,800 area. And even lower levels beckon.
There is an alternative scenario, and that is that the market could move above the fifth tramline and head for the Fibonacci 50% retrace level at 11,600 just where my upper up-sloping tramline meets it. How convenient!
Because the upside is limited from here, and we have a clear A-B-C corrective pattern and a potential negative momentum divergence, I will not be going for a long trade here.
Also, the medium-term trend has definitely turned down and although I took a nice profit from that previous long trade, taking advantage of the extreme volatility, I will rest on my laurels here!
So now I have a trading plan. Let's see how it pans out.
Don't miss my next trading insight. To receive all my spread betting blog posts by email, as soon as I've written them, just sign up here .
Get the latest financial news, insights and expert analysis from our award-winning MoneyWeek team, to help you understand what really matters when it comes to your finances.
John is is a British-born lapsed PhD physicist, who previously worked for Nasa on the Mars exploration team. He is a former commodity trading advisor with the US Commodities Futures Trading Commission, and worked in a boutique futures house in California in the 1980s.
He was a partner in one of the first futures newsletter advisory services, based in Washington DC, specialising in pork bellies and currencies. John is primarily a chart-reading trader, having cut his trading teeth in the days before PCs.
As well as his work in the financial world, he has launched, run and sold several 'real' businesses producing 'real' products.
-
 Inheritance tax investigations net HMRC an extra £246m from bereaved families
HMRC embarked on almost 4,000 probes into unpaid inheritance tax in the year to last April, new figures show, in an increasingly tough crackdown on families it thinks have tried to evade their full bill
-
 Average UK house price reaches £300,000 for first time, Halifax says
While the average house price has topped £300k, regional disparities still remain, Halifax finds.