Now here comes the rally in the euro
With careful use of trading methods, you can achieve pinpoint accuracy when making your trades, says John C Burford. Here, he plans his latest foray into the euro market.
Get the latest financial news, insights and expert analysis from our award-winning MoneyWeek team, to help you understand what really matters when it comes to your finances.
You are now subscribed
Your newsletter sign-up was successful
Want to add more newsletters?

Twice daily
MoneyWeek
Get the latest financial news, insights and expert analysis from our award-winning MoneyWeek team, to help you understand what really matters when it comes to your finances.

Four times a week
Look After My Bills
Sign up to our free money-saving newsletter, filled with the latest news and expert advice to help you find the best tips and deals for managing your bills. Start saving today!
It has been a while since I covered the euro, and recently this market has presented some excellent examples of how to use my trading methods to pinpoint trade entries.
And note not a word about quantitative easing!
First, let's get an overall picture of the EUR/USD market.
MoneyWeek
Subscribe to MoneyWeek today and get your first six magazine issues absolutely FREE

Sign up to Money Morning
Don't miss the latest investment and personal finances news, market analysis, plus money-saving tips with our free twice-daily newsletter
Don't miss the latest investment and personal finances news, market analysis, plus money-saving tips with our free twice-daily newsletter
Here is the daily chart going back to the 2008 high at 1.60. How would you describe the market since then bull, bear or neutral?
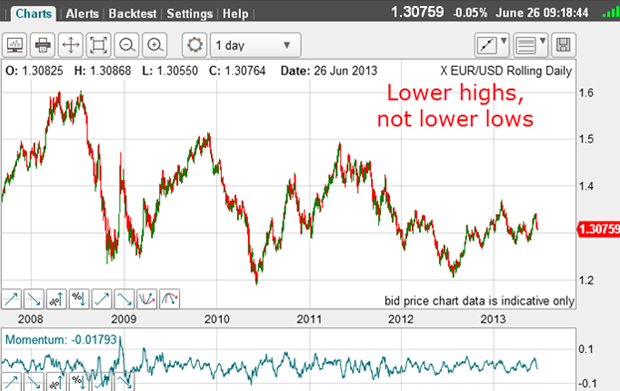
The swing trader's definition of a bear market is one with lower highs and lower lows. We have lower highs alright, but not lower lows. Since 2008, the lows have been around the 1.20 level. So, on this scale, we have no bear market.
Of course there have been many very large swings, both up and down and we can call these bear and bull cycles. These are the swings I wish to exploit in my trading.
For instance, the move off the May 2011 high at 1.50 only bottomed in August 2012 at 1.20 a move of 3,000 pips. To me, that was a real bear market! And it contained a clear five-wave pattern with a positive-momentum divergence at the low (the selling was drying up).
Whenever you see genuine five-wave patterns, expect a counter-trend move. That is a great time to take at least some profits from your shorts.
And from this August 2012 low at 1.20, there is a clear A-B-C rally complete with a negative-momentum divergence at the rally high.
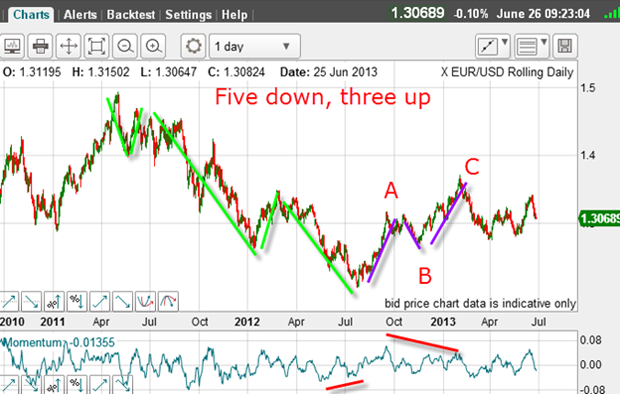
Also, the third wave down contains a clear five-wave pattern.
Two possible trades
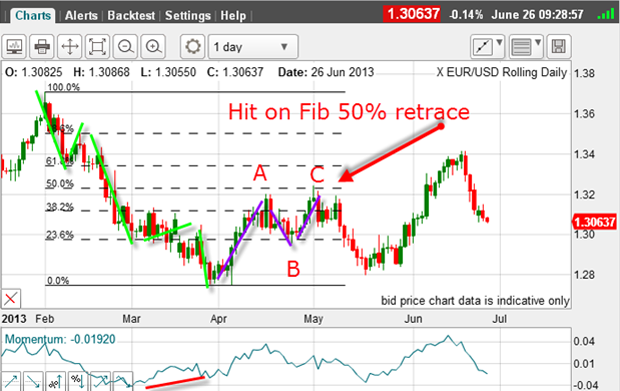
The move down from the 1.37 top has a five-wave structure as marked by green bars. The third wave is long and strong (wave 3 momentum is weak), and the wave 5 low sports a positive-momentum divergence (red bar).
With this fifth wave complete, Elliott wave theory says the next move is up in a counter-trend move. And usually, this move takes a three-wave form in anA-B-C. That is precisely what occurred, with the C wave touching the Fibonacci 50% level on the nose before peeling back down again.
There were two possible great trades on this rally. First, a long trade near the low, and then a short trade near the 50% retrace.
Normally, after the A-B-C, the market would go on to make new lows. But as so often happens, the market surprised me! It rallied from the 1.28 level again, failing to make a new low.
So now, the possibility was that the market would trace out a larger A-B-C. Failure to make a new low is a possible signal that the decline is not over.
But where would the new C wave top out?
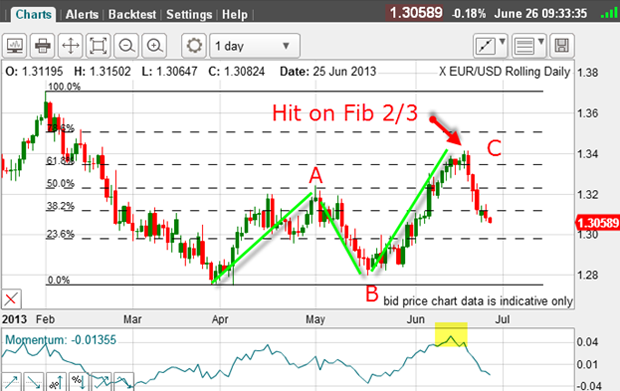
The rally was strong, and many buy stops were taken out above the old C wave high at 1.32. This was a classic short squeeze, of course.
But the squeeze was over when the market hit the Fibonacci 2/3 (67%) level and the rally established the larger A-B-C form.
That was another great trade entry point. Note that the momentum at the top was overbought another signal that the move was exhausted. Another sign of exhaustion is the lovely five-wave rally complete with a negative-momentum divergence at the wave 5 high.
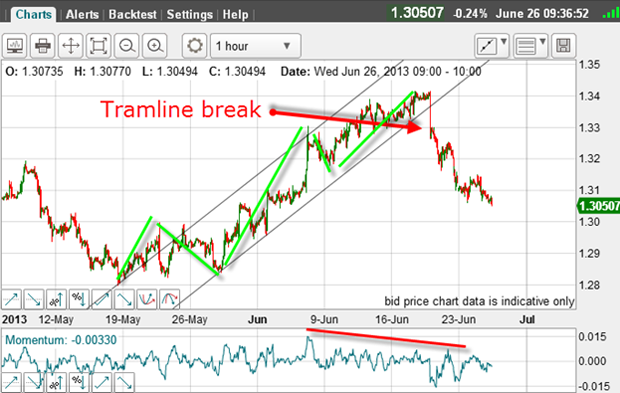
And that was another great short entry on the tramline break.
OK, since this top last Wednesday, the market has dropped sharply.
Let's again apply the Fibonacci levels to the most significant high and low:
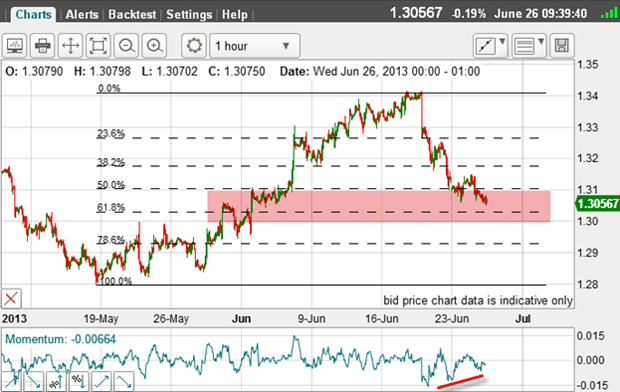
The market has come down to the Fibonacci 50% level and is currently testing the 62% level.
But note the strengthening momentum (red bar) on the way down.
Also, the market is entering chart support (pink zone).
Putting all of this together I have a great case for taking a short-term profit on my short trade, as the odds favour a rally of some sort from here.
And if a significant low is put in near here, I will again apply my Fibonacci tool to the latest wave and again search out for another low-risk entry.
Despite the long-term trend being neutral, swing traders can still take out major profits from the swings along the way using a simple methodology, such as mine.
Get the latest financial news, insights and expert analysis from our award-winning MoneyWeek team, to help you understand what really matters when it comes to your finances.
John is is a British-born lapsed PhD physicist, who previously worked for Nasa on the Mars exploration team. He is a former commodity trading advisor with the US Commodities Futures Trading Commission, and worked in a boutique futures house in California in the 1980s.
He was a partner in one of the first futures newsletter advisory services, based in Washington DC, specialising in pork bellies and currencies. John is primarily a chart-reading trader, having cut his trading teeth in the days before PCs.
As well as his work in the financial world, he has launched, run and sold several 'real' businesses producing 'real' products.
-
 Can mining stocks deliver golden gains?
With gold and silver prices having outperformed the stock markets last year, mining stocks can be an effective, if volatile, means of gaining exposure
-
 8 ways the ‘sandwich generation’ can protect wealth
People squeezed between caring for ageing parents and adult children or younger grandchildren – known as the ‘sandwich generation’ – are at risk of neglecting their own financial planning. Here’s how to protect yourself and your loved ones’ wealth.