Has the Dow Jones made its final high?
The Dow has been teasing the bears with a series of short declines, says John C Burford. But now, this could be the big one.
Get the latest financial news, insights and expert analysis from our award-winning MoneyWeek team, to help you understand what really matters when it comes to your finances.
You are now subscribed
Your newsletter sign-up was successful
Want to add more newsletters?

Twice daily
MoneyWeek
Get the latest financial news, insights and expert analysis from our award-winning MoneyWeek team, to help you understand what really matters when it comes to your finances.

Four times a week
Look After My Bills
Sign up to our free money-saving newsletter, filled with the latest news and expert advice to help you find the best tips and deals for managing your bills. Start saving today!
This market is starting to get interesting from a bearish perspective - again. As you know, my background view is this: I expect the US stock markets to complete their five-year-plus rallies, and then suffer huge down moves to below the March 2009 lows. That is my background scenario.
If I am correct, then a well-timed short trade should pay handsome dividends that could grow over many months in a short-and-hold trade. These are very unusual for a swing trader, as my normal trades last anywhere from a few days to only a few weeks.
Locating the tops over the past few months has been very tough, I confess. But I have been successful in identifying several temporary tops along the way and taking decent profits on the down swings but every time, the markets have swung back up and made new highs. It has been a little frustrating, to say the least!
MoneyWeek
Subscribe to MoneyWeek today and get your first six magazine issues absolutely FREE

Sign up to Money Morning
Don't miss the latest investment and personal finances news, market analysis, plus money-saving tips with our free twice-daily newsletter
Don't miss the latest investment and personal finances news, market analysis, plus money-saving tips with our free twice-daily newsletter
This might be the start of the big move down
Every time the market has made a new high and then moved down off that high, I become encouraged with the prospect this could be the big one!
But now, I have some very good evidence (although not conclusive) that this last push up was the final thrust which kicks off the big move down.
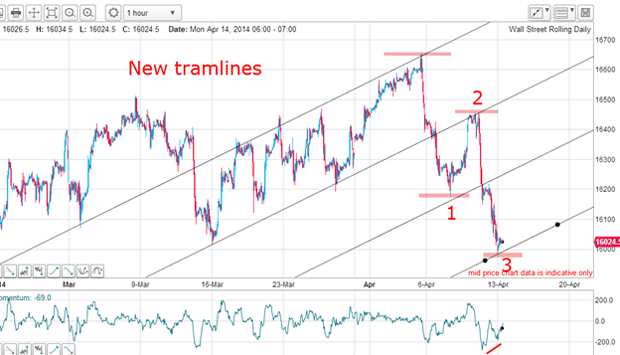
After taking the profit on my latest short trade, the market roared back up to confirm the A-B-C pattern, but crucially, has not made a new high. The closing high on the Dow remains the December 31 high at 16,600. Basically, the market has gone nowhere in four months.
How I know when a bull trend is ending

Since the market bounced up off the lowest tramline, the move down was in reality an A-B-C and not a 1, 2, 3 of a five-wave pattern, as I first suspected. The rally carried above the wave 2 high last week and that move cancelled out my five motive waves suggestion.
Why am I so keen on finding a motive pattern down off a high? It is simply because a five-wave move with the right characteristics is the clue that the bull trend is likely over. That is standard Elliott wave theory. If I can identify that pattern, I may well have identified the start of a big wave down.
What are the right characteristics? I need to see a long and strong third wave and a clear division into three waves down and two counter-trend waves up. I would also like to see a positive-momentum divergence at the wave 5 low. This could show up on the hourly chart or even the 15-minute chart.
The perfect low-risk trade

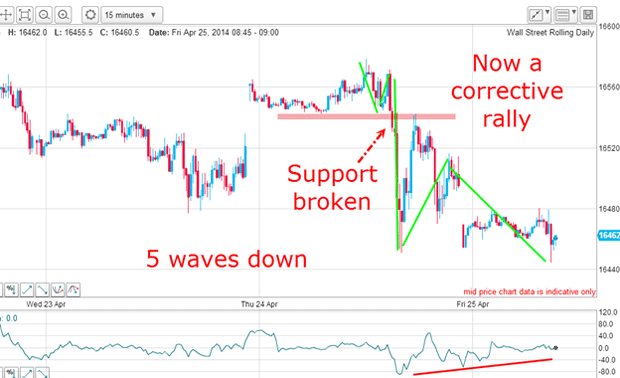
There was a gap created on the way up from a bullish Ukraine break-through reaction.
But look at what happened shortly thereafter the market made a slight new high and broke sharply in five clear waves with my wave 3 long and very strong, then a new low in wave 5 and a large positive-momentum divergence there. Perfect!
Because I was anticipating this break, I entered a sell order on the break of support in the 16,530 area with protective stop just above the high at 16,570 for a very low risk of 40 pips.
Remember, I am only interested in low-risk trades trades where I can place a sensible stop-loss a small distance away from entry. This one fits the bill beautifully.
We've only had three waves down so far
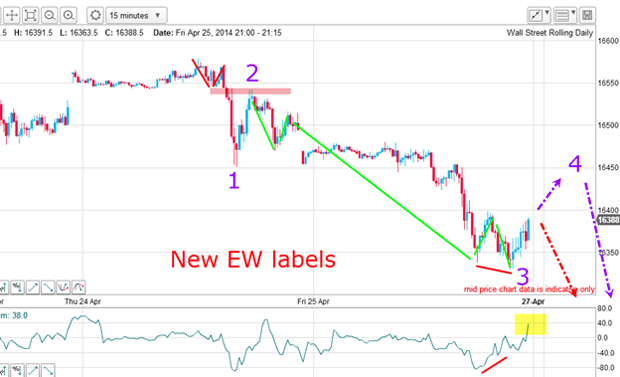
On Friday, the market moved even lower and that caused me to re-assess my Elliott wave labels. Now, I have a clear motive wave pattern forming:

The first thrust down is my new wave 1, the rally to pink resistance is wave 2 and the very long and strong wave down is wave 3. Note the positive-momentum divergence that warned of a likely bounce.
And late on Friday, the market made a small correction which is part of wave 4. As I write this morning, the market is extending higher in wave 4.
Now, wave 4 has two options as I see it.
The first option is that the market declines immediately below the wave 3 low in wave 5. The other option is for wave 4 to develop more to the upside before then moving down to new lows in wave 5.
Eagle-eyed readers will have spotted that we have only three waves down so far just as we did in mid-April (see 14 April post). So the possibility remains that this is just another corrective A-B-C before new highs are attempted.
Confirmation of a five-wave pattern would be provided if the market moves much below the wave 3 low at the 15,330 area. This is my line in the sand. And if we do have an A-B-C, the rally will carry above the 16,450 area. That would be a sensible place to lower the protective stop.
Will the bears be roaring in pain or pleasure?

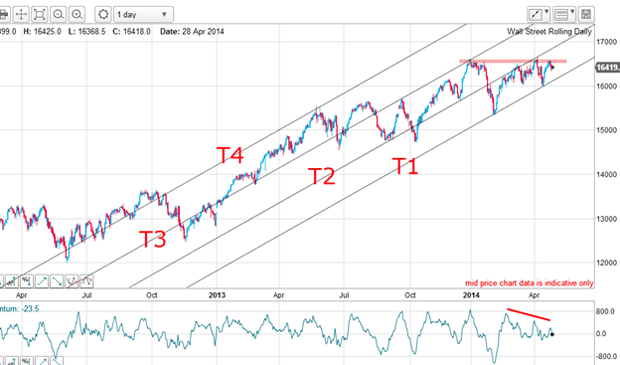
Here is my excellent tramline quartet. The two recent lows are touch points on T1 and the recent rallies have made kisses on T2. T3 has the December 31 high as a kiss touch point and T4 has the notorious 22 May spike high touch point.
The key resistance area is the 16,600 area marked in pink. A break above that would set the bears roaring in pain. But a break of T1 would make them roar in pleasure.
Get the latest financial news, insights and expert analysis from our award-winning MoneyWeek team, to help you understand what really matters when it comes to your finances.
John is is a British-born lapsed PhD physicist, who previously worked for Nasa on the Mars exploration team. He is a former commodity trading advisor with the US Commodities Futures Trading Commission, and worked in a boutique futures house in California in the 1980s.
He was a partner in one of the first futures newsletter advisory services, based in Washington DC, specialising in pork bellies and currencies. John is primarily a chart-reading trader, having cut his trading teeth in the days before PCs.
As well as his work in the financial world, he has launched, run and sold several 'real' businesses producing 'real' products.
-
 Should you buy an active ETF?
ETFs are often mischaracterised as passive products, but they can be a convenient way to add active management to your portfolio
-
 Power up your pension before 5 April – easy ways to save before the tax year end
With the end of the tax year looming, pension savers currently have a window to review and maximise what’s going into their retirement funds – we look at how