Has gold topped out in the charts?
Gold has been following the script so far. But here, John C Burford explains why it would be wise to expect a reversal.
Get the latest financial news, insights and expert analysis from our award-winning MoneyWeek team, to help you understand what really matters when it comes to your finances.
You are now subscribed
Your newsletter sign-up was successful
Want to add more newsletters?

Twice daily
MoneyWeek
Get the latest financial news, insights and expert analysis from our award-winning MoneyWeek team, to help you understand what really matters when it comes to your finances.

Four times a week
Look After My Bills
Sign up to our free money-saving newsletter, filled with the latest news and expert advice to help you find the best tips and deals for managing your bills. Start saving today!
I thought I would cover the gold story today, because many of the scenarios that I outlined in my last post of 5 March Gold is at a crossroads in the charts - have come to pass. On top of that, the charts are throwing up some very definite patterns. And they're ones that I have seen many times before.
In fact, the recent action has vindicated my cautious stance concerning my long position which I took near the $1,200 level in early January.
A tell-tale sign that the rally has topped
MoneyWeek
Subscribe to MoneyWeek today and get your first six magazine issues absolutely FREE

Sign up to Money Morning
Don't miss the latest investment and personal finances news, market analysis, plus money-saving tips with our free twice-daily newsletter
Don't miss the latest investment and personal finances news, market analysis, plus money-saving tips with our free twice-daily newsletter
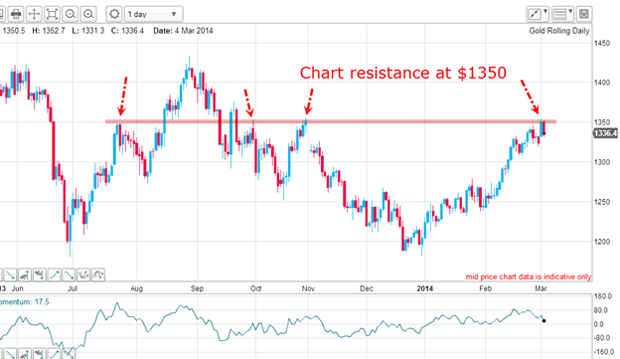
But then, while I was away, there was enough buying strength to push through this resistance. And it took out many protective buy-stops placed there by the shorts. This running of the stops' showed up as a rapid advance.
Here is the chart updated:
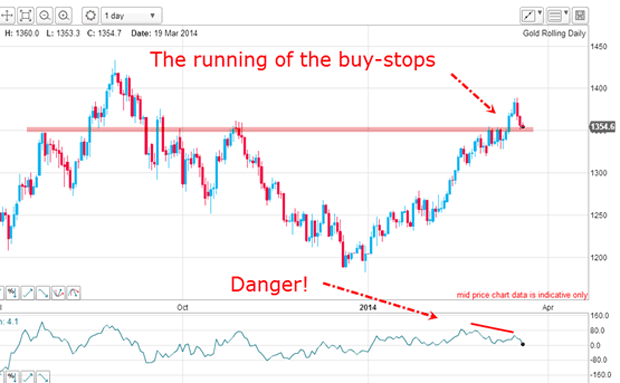
The market advanced by nearly $40 in just three days as it ran through the stops. The swiftness of this rally was a tell-tale sign that the buy-stops had been satisfied. And when that happens, the most likely path would then be down as the buying power had exhausted.
This is an excellent example of how you can forecast a reversal from such a short-covering event and look to take profits on a long position. And this is exactly what I did.
Proceed with caution
This is precisely the opposite of how many traders think. They believe that since the market is rewarding them for their expertise in picking a winner, why not go for more? Let's let the trend be my friend!
And this is where you can go astray, since an increasingly bullish feeling could induce you to do some dangerous things, such as add to your position near the top. Even a small reversal could then wipe out your hard-earned gains. This is very disheartening and would help destroy any confidence you had.
My advice: become more sceptical when long as a rally progresses.
There were two big warning signs for me that the rally was likely to top out. First, there was the bullish sentiment data showing bullish expectations running at near record levels (the daily sentiment index had reached over 80% bulls).
The second sign was the potential large negative-momentum divergence in the latter stages of the rally (red bar). This was confirmation that the buying power was waning.
Will the gold bull market make a comeback?
Remember, with the vast majority in the bullish camp at the highs, there is greater potential for sharp falls than there is for an extension of the rally.
But gazing at the above chart, the market has fallen back to the $1,350 support level. The big question is: will the support hold and the bull market resume?
Last time, I outlined several possible scenarios. This was one of them:
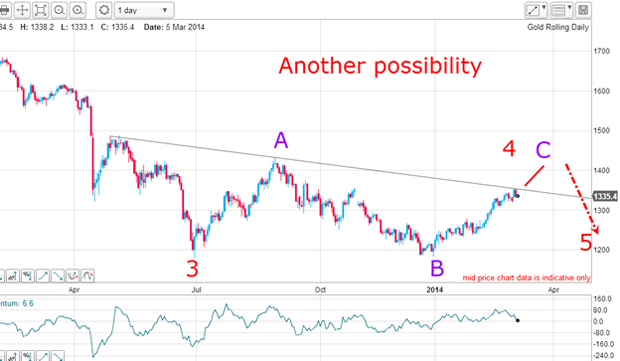
The rally off the December lows is my C wave of an A-B-C pattern. This wave coincided with the large wave 4 up from the wave 3 low from last summer.
The market did break above the downtrend line and here is the chart updated:
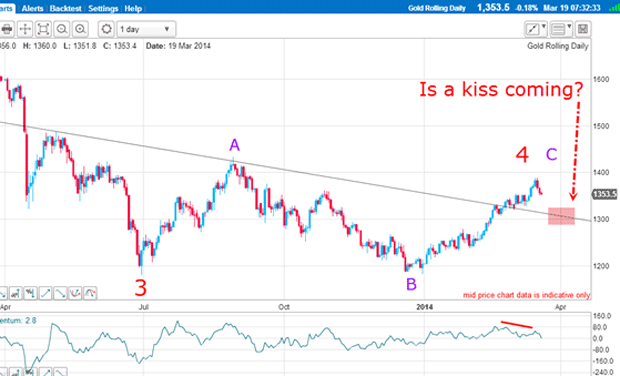
But if my C wave has ended this week, we should see a pull-back to the line in a traditional kiss.
So there are two hurdles to overcome for any further weakness. First, there is the current $1,350 level highlighted on my first chart, and second, the $1,300 level where the kiss would occur.
But is it too soon to write off the C wave rally?
The bulls have had their shock now it's time for a bounce
On Monday, the market edged up to $1,389 just $11 short - and then promptly fell away to the current $1,350 area. This is a shock of $40 in two days.
It's time to take a look at the hourly chart for clues:
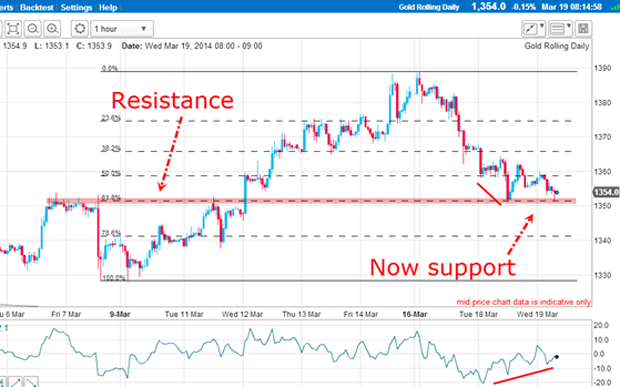
The $1,350 level was resistance and with the break on 12 March, now became support and this support is currently being tested.
The interesting feature here is the very large positive-momentum divergence with the market testing support.
This is leading me to believe we shall see a bounce from here. Selling pressure is waning and the larger trend is still up.
Here is a possible scenario:
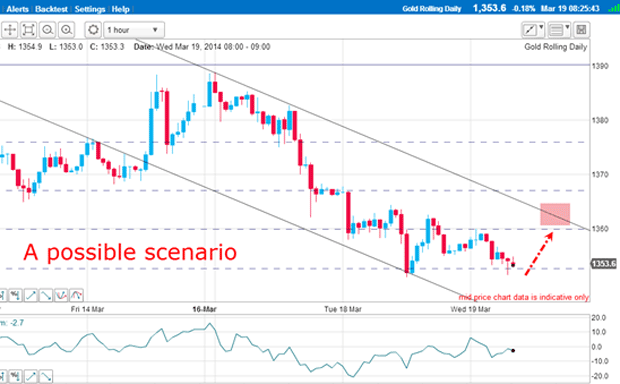
I have drawn in my tentative tramline pair. The lower line has a nice PPP (prior pivot point) and only one touch point (so far). Any rally off the $1,350 support should reach the upper tramline in the $1,360 area at least. And a break upwards of this line could result in an even larger rally.
When will we see the gold top?
Let's examine the state of the market following the sharp two-day fall of $40. This must have unnerved many bulls, who I am sure will take the opportunity to exit on any decent rally. This means rallies should be contained.
And as the tensions over Ukraine dissipate, gold should be under pressure.
In the last section of my 5 March post, I alluded to the 1980 Russian invasion of Afghanistan which marked the very top in gold which lasted for decades. I wondered if the Russian 'invasion' of Crimea would mark a similar top in gold. Hmm.
Get the latest financial news, insights and expert analysis from our award-winning MoneyWeek team, to help you understand what really matters when it comes to your finances.
John is is a British-born lapsed PhD physicist, who previously worked for Nasa on the Mars exploration team. He is a former commodity trading advisor with the US Commodities Futures Trading Commission, and worked in a boutique futures house in California in the 1980s.
He was a partner in one of the first futures newsletter advisory services, based in Washington DC, specialising in pork bellies and currencies. John is primarily a chart-reading trader, having cut his trading teeth in the days before PCs.
As well as his work in the financial world, he has launched, run and sold several 'real' businesses producing 'real' products.
-
 MoneyWeek Talks: The funds to choose in 2026
Podcast Fidelity's Tom Stevenson reveals his top three funds for 2026 for your ISA or self-invested personal pension
-
 Three companies with deep economic moats to buy now
Opinion An economic moat can underpin a company's future returns. Here, Imran Sattar, portfolio manager at Edinburgh Investment Trust, selects three stocks to buy now