Gold is at a crossroads in the charts
The gold price is closing in on John C Burford's target in the charts. But first it must overcome a stiff line of resistance.
Get the latest financial news, insights and expert analysis from our award-winning MoneyWeek team, to help you understand what really matters when it comes to your finances.
You are now subscribed
Your newsletter sign-up was successful
Want to add more newsletters?

Twice daily
MoneyWeek
Get the latest financial news, insights and expert analysis from our award-winning MoneyWeek team, to help you understand what really matters when it comes to your finances.

Four times a week
Look After My Bills
Sign up to our free money-saving newsletter, filled with the latest news and expert advice to help you find the best tips and deals for managing your bills. Start saving today!
A heads up that this is my last post before I take a short break. My next one will be on Friday, 14 March. In the meantime, I hope you have fun using your tramlines, Fibonaccis and Elliott waves.
Gold received a boost from Mr Putin on Monday over the Ukraine affair. I spent the weekend trying to remember my school history lessons and recalled that in the Crimean War of the 1850s, Russia was defeated. But I believe the result would be a little different this time.
That said, any shooting war seems like a very distant prospect, simply because nations today are so intertwined economically. Damage to one means damage to all.
MoneyWeek
Subscribe to MoneyWeek today and get your first six magazine issues absolutely FREE

Sign up to Money Morning
Don't miss the latest investment and personal finances news, market analysis, plus money-saving tips with our free twice-daily newsletter
Don't miss the latest investment and personal finances news, market analysis, plus money-saving tips with our free twice-daily newsletter
Either way, gold is getting closer to my target at the $1,400 area that I had set last year.
I've also noticed that I'm no longer the only one with this figure as a target. I'm reading many such forecasts lately this is inevitable when gold has been in a solid two-month rally, lifting prices by about $180. Remember, markets make opinions, and contrarians use this knowledge to get on board a new trend early.
Why I'm cautious about the gold bull market
But I do not use sentiment readings alone to justify a trade. I only use them to confirm a trade which I have researched by my usual methods. Taken together, this is a powerful package.
In December, the bear market was over a year old and was fully entrenched in people's minds. There was even a solid story behind the decline (stocks good, gold bad).
But two months later, bullish sentiment has rocketed to around the 80% area a level where previous tops have been made. It is unusual to read a short-term bearish opinion today.
This is making me very cautious for the very same reason that I became bullish two months ago.
The market has hit an important resistance level

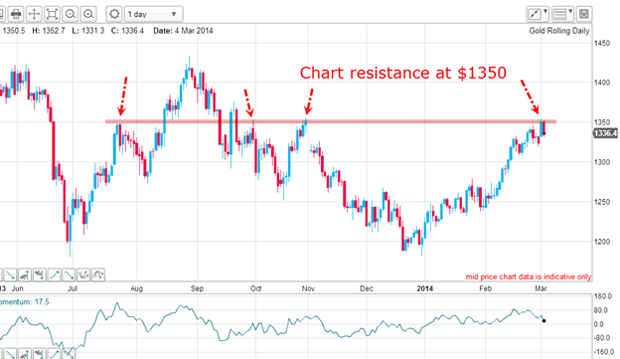
But that's not all. The $1,350 level is also chart resistance. I have placed arrows where major market turns have occurred. The market believes the $1,350 level is significant. My conclusion: it would take a big effort to push well above this level in the near-term.
Gazing at the daily chart above, I am having great difficulty placing any major Elliott waves on the rally. In a two-month span of trading, this is very unusual, especially in the gold chart. The rally has been without even a minor setback.
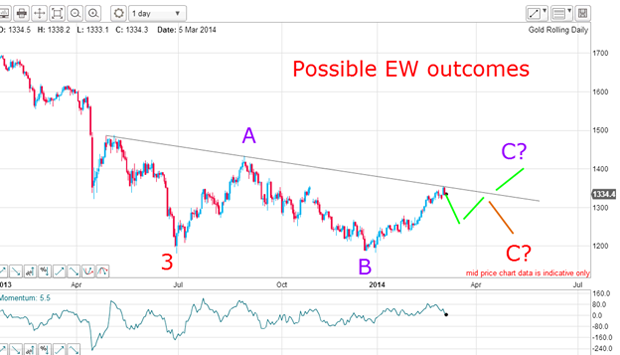
My conclusion: this rally could be the first large wave of an unfolding pattern say an A wave of an A-B-C, or perhaps a wave within a very large triangle.

Here are two possibilities (there are more). My purple A and B waves are as I had them earlier this year. We are currently in purple wave C. This C wave could terminate here, or it could extend above my downtrend line.
If my excellent downtrend line is operative, and it reinforces the resistance mentioned above, then the market could bounce down from here. That seems to be the path of least resistance.
After that, the market could find support from 'late to the party' bulls, who were waiting for a dip to get long. This would push the market back up to my downtrend line. And another big test of the bull market's strength would ensue.
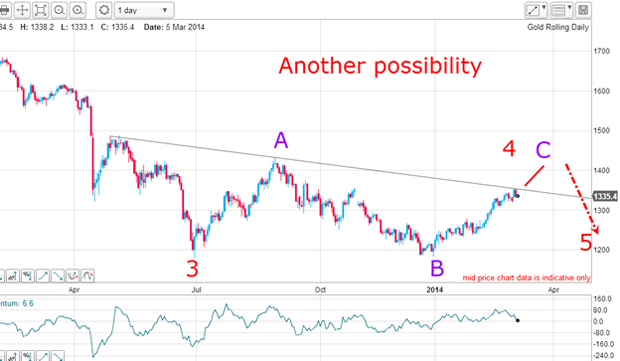
The other valid possibility is for the resistance at $1,350 to be overcome within the next few days and produce this picture:

Here, the market would move above my downtrend line to complete the C wave, which would also complete wave 4. My guess is that there are many buy-stops placed above $1,350 by old bears who have retained their positions throughout the rally.
If this occurs, the market will then decline to new lows in wave 5, which should approach the $1,000 area.
All of my analysis means that the market is at critical juncture as it closes in on my $1,400 target. If the market does break above $1,350 convincingly, then my best guess is that the market will fall short of the precise and now widely-touted $1,400 target.
History lessons for traders
Likewise, in October 2012, when the market was also in full rally mode, a common target was $1800. The actual top fell $4 short before peeling away.
The lesson here? When a round-number target is widely anticipated, it is rarely hit on the nose. If you have a trade, it is usually best to look to exit as common targets are approached.
Finally, I will leave you with this thought. If, like me, you can remember the huge gold bull market in the 1970s that produced a spike high above $850 in late 1979, then Russia's invasion of a neighbouring country should ring a few bells.
Back then, Russia invaded Afghanistan because of the problems created by insurgents in that country. Plus a change. The concern in the West was that the Cold War could rapidly turn into a hot one. Tensions ran very high.
And the very date of the massive invasion across the border marked the exact top in gold. The knee-jerk reaction of the market to this event was to push gold higher. But buying quickly became exhausted and it was downhill from then on for many years. It was a classic buy the rumour, sell the news' event.
But that was a grinding shooting war which resulted in Russia withdrawing with its tail between its legs. Today, conditions are vastly different. But all the same, could today's events in Ukraine herald at least a minor top in gold?
Get the latest financial news, insights and expert analysis from our award-winning MoneyWeek team, to help you understand what really matters when it comes to your finances.
John is is a British-born lapsed PhD physicist, who previously worked for Nasa on the Mars exploration team. He is a former commodity trading advisor with the US Commodities Futures Trading Commission, and worked in a boutique futures house in California in the 1980s.
He was a partner in one of the first futures newsletter advisory services, based in Washington DC, specialising in pork bellies and currencies. John is primarily a chart-reading trader, having cut his trading teeth in the days before PCs.
As well as his work in the financial world, he has launched, run and sold several 'real' businesses producing 'real' products.
-
 ISA fund and trust picks for every type of investor – which could work for you?
Whether you’re an ISA investor seeking reliable returns, looking to add a bit more risk to your portfolio or are new to investing, MoneyWeek asked the experts for funds and investment trusts you could consider in 2026
-
 The most popular fund sectors of 2025 as investor outflows continue
It was another difficult year for fund inflows but there are signs that investors are returning to the financial markets