Has gold finally topped?
Gold has rocketed in price as investors flee stocks for safer assets. But with the markets now rallying, has gold hit the top? John C Burford looks to the charts for answers.
Get the latest financial news, insights and expert analysis from our award-winning MoneyWeek team, to help you understand what really matters when it comes to your finances.
You are now subscribed
Your newsletter sign-up was successful
Want to add more newsletters?

Twice daily
MoneyWeek
Get the latest financial news, insights and expert analysis from our award-winning MoneyWeek team, to help you understand what really matters when it comes to your finances.

Four times a week
Look After My Bills
Sign up to our free money-saving newsletter, filled with the latest news and expert advice to help you find the best tips and deals for managing your bills. Start saving today!
I have been giving blanket coverage to the Dow for some time now, and yesterday, I warned you to expect a note on gold very soon.
Well, I now have a good reason to cover it. I have been keeping a keen eye on gold, especially since it thrust above the $1,600 level, when I last covered it: My gold call was wrong but I escaped without a loss.
Because I normally sign off my emails by 9am, they may well be way out of date by the time you get to them. Or, they may be extremely relevant!
MoneyWeek
Subscribe to MoneyWeek today and get your first six magazine issues absolutely FREE

Sign up to Money Morning
Don't miss the latest investment and personal finances news, market analysis, plus money-saving tips with our free twice-daily newsletter
Don't miss the latest investment and personal finances news, market analysis, plus money-saving tips with our free twice-daily newsletter
Just to finish coverage of the Dow from yesterday, the market did back off from my fourth tramline, where I placed a new short trade. It then fell below my first target, sub-10,800, to make a low in the 10,600 area.
From this low, I covered my short trade, and then the Dow rallied further, taking it right back up to my fourth tramline at 10,900.
It was knocking on the door again. And this time, the door swung wide open!
I shall be back to the Dow next week.
What the surprise' Dow rally did for gold
Because gold has been one of the very few beneficiaries of the flight-to-safety sentiment sweeping the markets, any decent rally in the Dow should induce profit-taking from some of the gold bulls.
And yesterday, Comex, the gold futures exchange, raised futures margins.
They do this when a market becomes either very volatile, or the value of the 100 oz contract rises above certain levels.
At the $1,814 high on 10 August, that value is $181,400.
The inference is that some longs, who are over-leveraged, will be forced to cut back on their positions, putting downward pressure on prices.
If you recall, when silver was making its $50 high earlier this year, Comex also increased margins and the market promptly fell.
And because there is an overwhelming bias to the long side, even a little profit-taking by the huge army of longs will be met by a paucity of buying (at $1,800+, who is left to buy?).
Here is the latest Commitments of Traders report:
| Hedge funds | 292,000 (+13,000) | 45,000 (+2,000) |
| Change in past wk | 155,000 | 442,000 |
| Small traders (us!) | 67,000 | 26,000 |
So the hedgies (the dominant sector) have been piling into gold in August since it broke through the $1,630 area.
Is this yet another historic case of traders reaching a peak of bullishness right at a top?
The signs that gold is heading for a decline
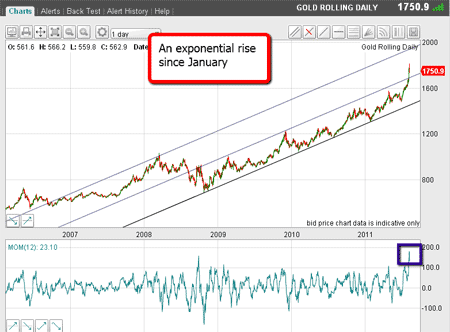
I have been following the chart during August and have been on high alert for signs of a top. Here is the long-term chart:

(Click on the chart for a larger version)
Daily momentum is off the scale!
In my view, all of the factors are in place for a significant decline.
One measure of trader sentiment gives a reading of 95% bulls right where tops are normally formed.
As we saw from the tops in the stock markets, the falls can be steeper and quicker than the rallies.
As we veteran traders say: the market takes its time to climb the stairs, but no time at all to fall out of the window!
Let's see what the charts are telling me:

(Click on the chart for a larger version)
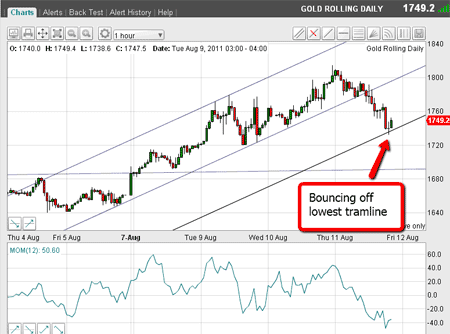
I first drew my central tramline, as it has been tracing the lows since early August. The upper tramline was easy to place right across the 9 August highs.
I can now draw my lowest tramline equidistant below the central line.
And guess what? The market last night fell right to this line at $1,740 and started a bounce from there. Isn't that pretty?
In anticipation, I waited for the break of the central tramline and placed a short trade there.
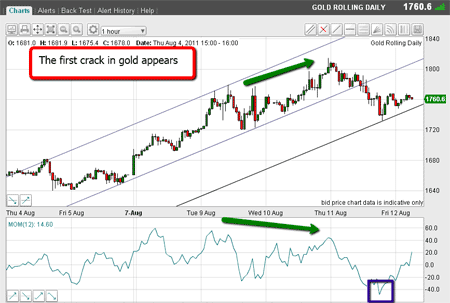
I had confidence in this position, since there was a nice negative momentum divergence at the $1,814 top (marked on the chart below).
Trading Tip: Always keep an eye on the momentum indicator, and be alert for divergences. They indicate an exhaustion of buying power. I have found them reliable on the 60-minute and 30-minute charts, and sometimes on the 15-minute charts, especially when there is high volatility (as in the Dow at present).
OK, so now I have a short position and have moved my stop to break even, so no matter what happens, I will suffer zero loss.
The question, of course, is: will the market break below my lowest tramline in the $1,640 area, or will it stand firm and go on to make new highs?
Here is the latest chart:

(Click on the chart for a larger version)
In my view, the odds significantly favour the former scenario. We shall see.
Incidentally, I promised you the launch of a video version of my posts. We have had a few technical glitches, but hopefully, the launch is a few days away. I shall keep you posted. Have a good weekend!
Don't miss my next trading insight. To receive all my spread betting blog posts by email, as soon as I've written them, just sign up here .
Get the latest financial news, insights and expert analysis from our award-winning MoneyWeek team, to help you understand what really matters when it comes to your finances.
John is is a British-born lapsed PhD physicist, who previously worked for Nasa on the Mars exploration team. He is a former commodity trading advisor with the US Commodities Futures Trading Commission, and worked in a boutique futures house in California in the 1980s.
He was a partner in one of the first futures newsletter advisory services, based in Washington DC, specialising in pork bellies and currencies. John is primarily a chart-reading trader, having cut his trading teeth in the days before PCs.
As well as his work in the financial world, he has launched, run and sold several 'real' businesses producing 'real' products.
-
 Average UK house price reaches £300,000 for first time, Halifax says
While the average house price has topped £300k, regional disparities still remain, Halifax finds.
-
 Barings Emerging Europe trust bounces back from Russia woes
Barings Emerging Europe trust has added the Middle East and Africa to its mandate, delivering a strong recovery, says Max King