Some great Elliott waves in the Nasdaq
America's more volatile Nasdaq index is throwing up some terrific Elliot waves. Can this tell us where the Dow is heading? John C Burford compares the charts.
Get the latest financial news, insights and expert analysis from our award-winning MoneyWeek team, to help you understand what really matters when it comes to your finances.
You are now subscribed
Your newsletter sign-up was successful
Want to add more newsletters?

Twice daily
MoneyWeek
Get the latest financial news, insights and expert analysis from our award-winning MoneyWeek team, to help you understand what really matters when it comes to your finances.

Four times a week
Look After My Bills
Sign up to our free money-saving newsletter, filled with the latest news and expert advice to help you find the best tips and deals for managing your bills. Start saving today!
The divergence between the Dow and the Nasdaq that I pointed out in Monday's post continues. It's throwing up some interesting possibilities in terms of Elliott waves.
This is the Nasdaq chart from Monday:
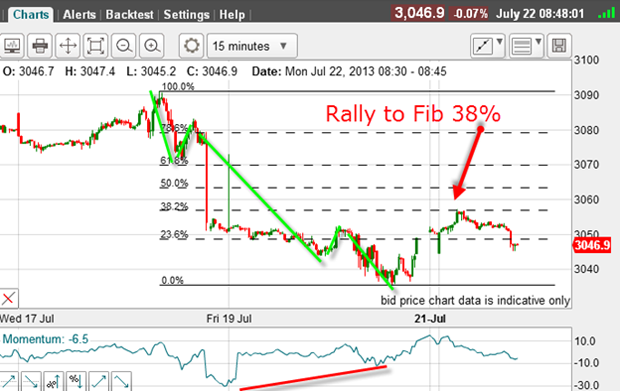
From last Thursday's high, I can count a very clear five-wave move down to Friday's low on this 15-minute chart. That is my first clue that the market may have turned.
MoneyWeek
Subscribe to MoneyWeek today and get your first six magazine issues absolutely FREE

Sign up to Money Morning
Don't miss the latest investment and personal finances news, market analysis, plus money-saving tips with our free twice-daily newsletter
Don't miss the latest investment and personal finances news, market analysis, plus money-saving tips with our free twice-daily newsletter
And there is a large positive-momentum divergence between waves 3 and 5 (red bar).
This is a textbook set-up for a relief rally of some kind and that's exactly what happened, with a move to the Fibonacci 38% retrace followed by a resumption of the downtrend.
At that point on Monday morning, there were a couple of directions the market could plausibly go. Because relief rallies off a five-wave down move are usually, but not always, in an A-B-C form, there was a chance the market would turn back up to form such an A-B-C.
The rally so far has only one leg, which could turn out to be the A wave with the B and C waves to follow.
Another possibility was for the market to resume its decline below Friday's low and go on to make a more complex wave pattern.
But if the former scenario played out, that would lend strength to the bearish case, since five waves down and three up is very often a prelude to a much larger decline. That could spell the end of the bull market.
How the market played out
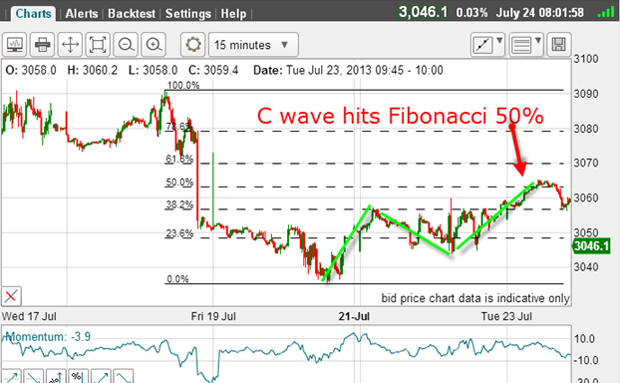
During Monday's session the market whipped around quite violently but did go on to reach the Fibonacci 50% level, thus finally making a clear A-B-C. That satisfied my preferred Elliott wave scenario.
A great trade was to short the market near that 50% retrace.
Now, I have enough trading off the Friday low to be able to look for tramlines and here they are:
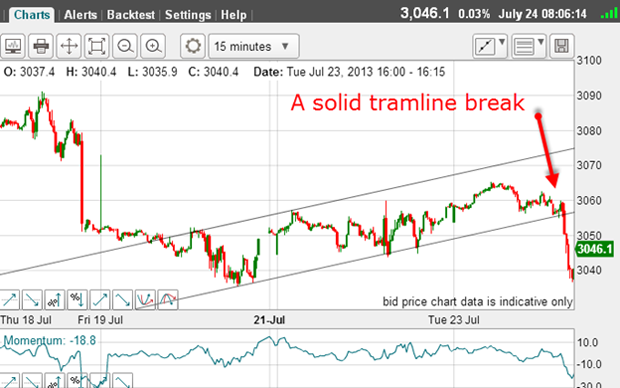
My lower line, which could draw in first, has four touch points and with Tuesday's trading, I could add another one, making five. This is enough to give this line five stars!
Then, my upper one has only two good touch points, but also sports a good prior pivot point (PPP), making that one a four star.
But the crucial point about these lines is this: the maximum C wave rally to the Fibonacci 50% level fell well short of the upper tramline. This indicates a weakening market and soon after, the market did break below the lower tramline.
So this falling short acted as a warning that the downtrend was likely back in force. So it proved.
And when the market broke that tramline, that was another excellent place to enter a short trade.
But I have more Elliott waves in Tuesday's trading.
Here is the move off the C wave high:
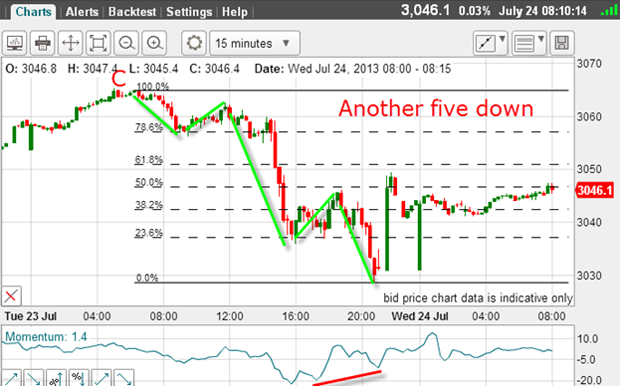
I have a clear wave count with wave 3 being long and strong, as required. And wave 4 has a clear A-B-C pattern. And there is a large positive-momentum divergence at the wave 5 low (red bar).
Naturally, after these five waves down, we expect a rally hopefully in three waves to a Fibonacci retrace... and that appears to be happening as I write.
But there is an alternative interpretation of the Elliott waves!
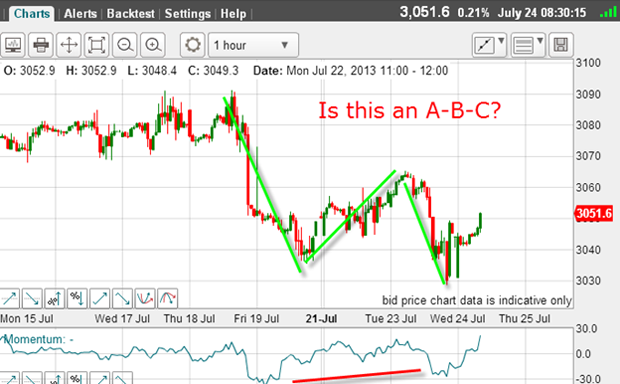
From Thursday's high on the hourly chart, we have a potential A-B-C down with a slight positive-momentum divergence (red bar). This implies that the main uptrend is still intact, of course.
As of this morning, both options have equal merit.
But what is happening over in the Dow as these Elliott waves are playing out in the Nasdaq?
Does the Dow fit this story?
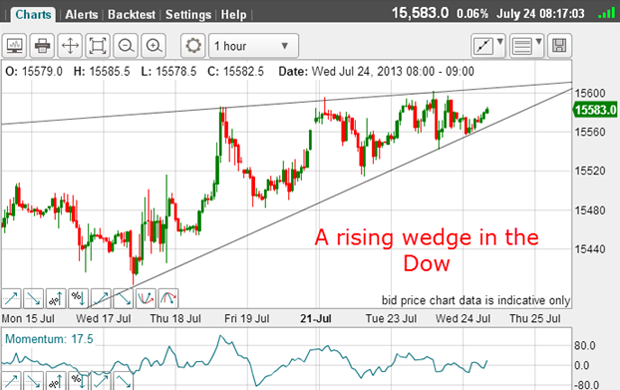
This is the hourly chart, but peer as I might, I cannot find any obvious Elliott waves to match those in the Nasdaq. There are many times when the Elliott waves just aren't visible.
But there is a rising wedge here. These patterns usually resolve in an opposite thrust in this case, down. The upper limit is the upper line and a sharp move above this line will likely cancel out my Nasdaq analysis.
All we can expect as traders is that our methods give us an edge but we must accept that sometimes our edge is blunt and give us a false signal. No method on earth can approach 100% reliability.
But running your winners and cutting your losers is the one strategy that ensures your survival and should provide superior returns over time.
Get the latest financial news, insights and expert analysis from our award-winning MoneyWeek team, to help you understand what really matters when it comes to your finances.
John is is a British-born lapsed PhD physicist, who previously worked for Nasa on the Mars exploration team. He is a former commodity trading advisor with the US Commodities Futures Trading Commission, and worked in a boutique futures house in California in the 1980s.
He was a partner in one of the first futures newsletter advisory services, based in Washington DC, specialising in pork bellies and currencies. John is primarily a chart-reading trader, having cut his trading teeth in the days before PCs.
As well as his work in the financial world, he has launched, run and sold several 'real' businesses producing 'real' products.
-
 ISA fund and trust picks for every type of investor – which could work for you?
Whether you’re an ISA investor seeking reliable returns, looking to add a bit more risk to your portfolio or are new to investing, MoneyWeek asked the experts for funds and investment trusts you could consider in 2026
-
 The most popular fund sectors of 2025 as investor outflows continue
It was another difficult year for fund inflows but there are signs that investors are returning to the financial markets