A signal for the Dow from the Nasdaq
Looking at other markets can give you useful clues as to where your chosen market is heading, says John C Burford, So, what can the more volatile Nasdaq tell us about the Dow?
Get the latest financial news, insights and expert analysis from our award-winning MoneyWeek team, to help you understand what really matters when it comes to your finances.
You are now subscribed
Your newsletter sign-up was successful
Want to add more newsletters?

Twice daily
MoneyWeek
Get the latest financial news, insights and expert analysis from our award-winning MoneyWeek team, to help you understand what really matters when it comes to your finances.

Four times a week
Look After My Bills
Sign up to our free money-saving newsletter, filled with the latest news and expert advice to help you find the best tips and deals for managing your bills. Start saving today!
The US stock markets are flying. Sentiment is very bullish not just towards stocks but also the wider economy, with real estate a major focus of positive comment. Even British people are getting more optimistic.
But as all students of sentiment data know from experience, market tops occur when sentiment measures show high levels of bullishness. And when we see these signs, we should expect a major top of some kind up ahead.
One of the great errors people make when discussing the stock market is that they believe a rising stock market indicates an improving economy, and is caused by an improvement in sentiment. They think that stocks forecast where the economy will be in the months ahead.
MoneyWeek
Subscribe to MoneyWeek today and get your first six magazine issues absolutely FREE

Sign up to Money Morning
Don't miss the latest investment and personal finances news, market analysis, plus money-saving tips with our free twice-daily newsletter
Don't miss the latest investment and personal finances news, market analysis, plus money-saving tips with our free twice-daily newsletter
This is patently false.
If it were true, then why has the market consistently made its major tops in history when the most recent economic data is super-positive and sentiment is extremely bullish? You would expect under this model that after positive news, the market would always react positively.
But sometimes it does and sometimes it does not. It depends on context within the Elliott wave structure!
New economic data reflects the position after the fact and has absolutely no forecasting power.
If GDP for the latest quarter is reported, that data reflects business up to six months ago! Conditions and sentiment will have changed in the interim. So it is current sentiment that determines the price level of stocks, not old data.
And since the decision to buy or sell stocks can be acted on instantly with the click of a mouse, the stock market, being so widely followed by the public, is the best thermometer of public sentiment in real time.
There are always negative developments lurking in the background the rapid slowdown in China is an example today.
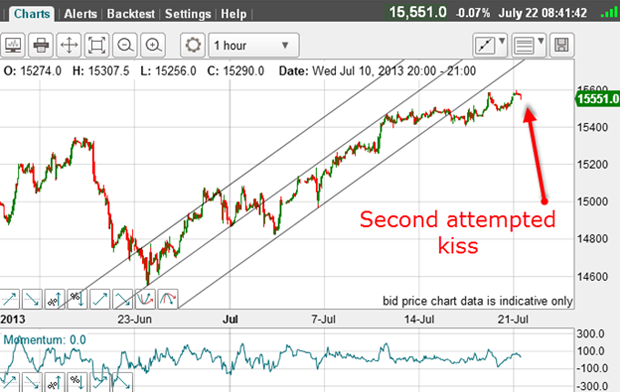
On Friday, I offered an analysis of the Dow and described two sets of tramlines that are currently working. And in one of them, we have seen a tramline break. Here is the current chart:

This break is the first sign that the stock market may be turning. It is not definitive, but could well be the first clue.
Also on Friday, the latest commitments of traders (COT) data shows another market swing to the bullish camp by the specs. Both the large and small specs took part in this and now the hedge funds (non-commercials) are now over seven-to-one in the bull camp.
| ($5 X DJIA INDEX) | Row 0 - Cell 1 | Row 0 - Cell 2 | Row 0 - Cell 3 | Open interest: 117,118 | ||||
| Commitments | ||||||||
| 45,411 | 6,341 | 620 | 54,201 | 97,344 | 100,232 | 104,305 | 16,886 | 12,813 |
| Changes from 07/09/13 (Change in open interest: 11,438) | ||||||||
| 1,729 | -1,635 | 69 | 7,853 | 13,354 | 9,651 | 11,788 | 1,787 | -350 |
| Percent of open in terest for each category of traders | ||||||||
| 38.8 | 5.4 | 0.5 | 46.3 | 83.1 | 85.6 | 89.1 | 14.4 | 10.9 |
| Number of traders in each category (Total traders: 98) | ||||||||
| 32 | 13 | 6 | 36 | 23 | 72 | 38 | Row 8 - Cell 7 | Row 8 - Cell 8 |
This data point is a flashing warning light for the bulls. It is a very crowded trade indeed.
A clue from the Nasdaq
Yes, I believe there is and it lies in the Nasdaq. The Nasdaq is regarded as much higher-risk that the Dow. It contains the shares of more speculative and early-stage companies, frequently in the technology industry.
Generally, when sentiment is bullish, the Nasdaq will out-perform the Dow and vice versa. That has been true recently.
Because more bullish energy is invested in the Nasdaq, I expect it to lead the way down, followed by the Dow.
The majority opinion is that we are in a recovery and projections of GDP growth are positive. The possibility of deflation has been dismissed as preposterous by the vast majority of economists.
To test whether my theory of markets is correct, let's monitor GDP data after the markets have turned down and check if the numbers match the current projections. That should be interesting!
Google and Microsoft turn the market
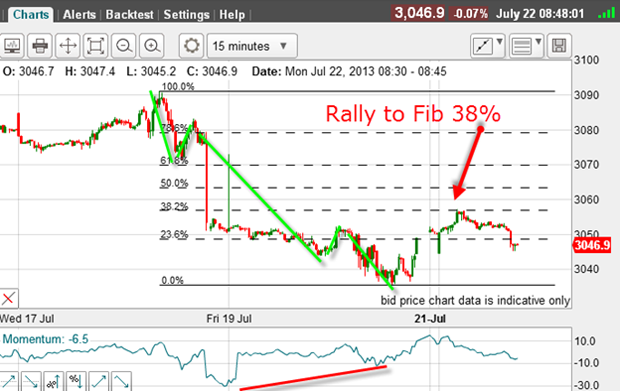
Let's take a look at this decline:

There is a clear five-wave impulse wave down to Friday evening's low.
There we have a clear sign that the market may have turned, since five waves down implies a change in trend according to the Elliott wave model.
And this morning, the relief rally has carried right to the Fibonacci 38% retrace and is currently declining again.
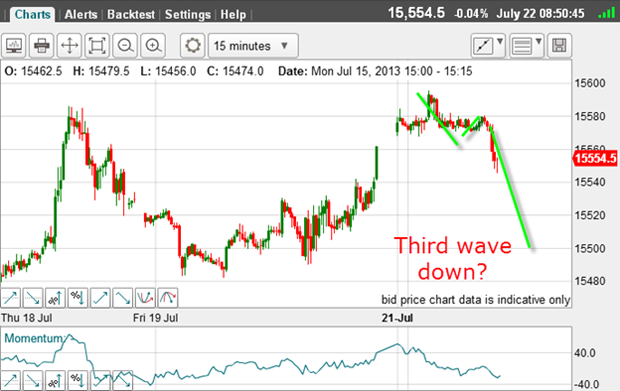
Of course, if the market continues its rally into new high ground, this picture is cancelled. And so far, the Dow has not followed suit by offering a similar five-wave pattern down yet.
But as I write, we may be in the early stages of it here is the 15-minute chart:

We could currently be in wave 3, which would take it close to the 15,520 area.
I have a feeling this week will reveal many more clues, and could be pivotal in many markets.
Get the latest financial news, insights and expert analysis from our award-winning MoneyWeek team, to help you understand what really matters when it comes to your finances.
John is is a British-born lapsed PhD physicist, who previously worked for Nasa on the Mars exploration team. He is a former commodity trading advisor with the US Commodities Futures Trading Commission, and worked in a boutique futures house in California in the 1980s.
He was a partner in one of the first futures newsletter advisory services, based in Washington DC, specialising in pork bellies and currencies. John is primarily a chart-reading trader, having cut his trading teeth in the days before PCs.
As well as his work in the financial world, he has launched, run and sold several 'real' businesses producing 'real' products.
-
 Average UK house price reaches £300,000 for first time, Halifax says
While the average house price has topped £300k, regional disparities still remain, Halifax finds.
-
 Barings Emerging Europe trust bounces back from Russia woes
Barings Emerging Europe trust has added the Middle East and Africa to its mandate, delivering a strong recovery, says Max King