Two tramline sets in the Dow
Sometimes the charts offer you nothing at all; sometimes, they offer several options. John C Burford looks at a couple of possible trades in the Dow Jones.
Get the latest financial news, insights and expert analysis from our award-winning MoneyWeek team, to help you understand what really matters when it comes to your finances.
You are now subscribed
Your newsletter sign-up was successful
Want to add more newsletters?

Twice daily
MoneyWeek
Get the latest financial news, insights and expert analysis from our award-winning MoneyWeek team, to help you understand what really matters when it comes to your finances.

Four times a week
Look After My Bills
Sign up to our free money-saving newsletter, filled with the latest news and expert advice to help you find the best tips and deals for managing your bills. Start saving today!
Sometimes the charts offer you nothing at all. But sometimes, a chart will offer several options for how to trade.
Here is the chart I showed on Monday:
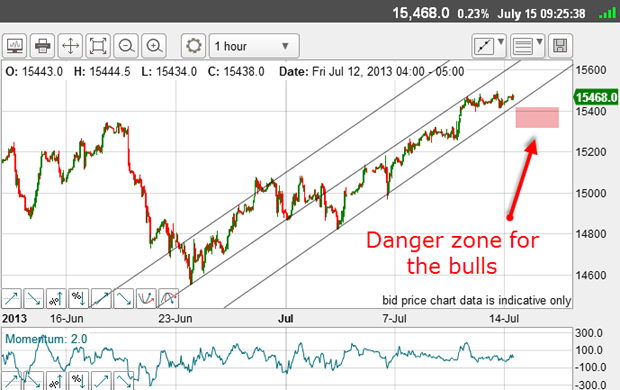
My base tramlineis the central one. That is the first tramline I drew. I chose this one simply because when I search for my first reliable tramline, I usually start from the most recent significant low. That was clearly the 24 June low.
MoneyWeek
Subscribe to MoneyWeek today and get your first six magazine issues absolutely FREE

Sign up to Money Morning
Don't miss the latest investment and personal finances news, market analysis, plus money-saving tips with our free twice-daily newsletter
Don't miss the latest investment and personal finances news, market analysis, plus money-saving tips with our free twice-daily newsletter
I then moved my line across the tops in the 4 10 July period and set it there. Gratifyingly, it also touched the lows in the 25 June 2 July trading.
This is crucial. The touch points on the line hit it precisely (within tolerance), and I can count at least eight. That makes it a highly reliable line of support/resistance.
There are no significant pigtails or overshoots on this line, and with a high number of excellent touch points, I'd give this line five stars!
From this line, I can now search for another tramline. Moving my parallel line down, I place it so as to touch the next significant low on 3 July.
This line also passes across the next low on 5 July. This means I have two excellent touch points on my lower line, making it a high-reliability line of support.
For completeness, I then drew the highest line, which has few touch points and cuts across much trading. So it's not terribly reliable. But it does have a prior pivot point(on 21 June) - one redeeming feature.
Let's fast forward to this morning and see whether any tramline has been penetrated. This will give clues as to any possible change of trend.
Remember, when a tramline is broken, it then changes character from a line of resistance to one of support and vice versa.
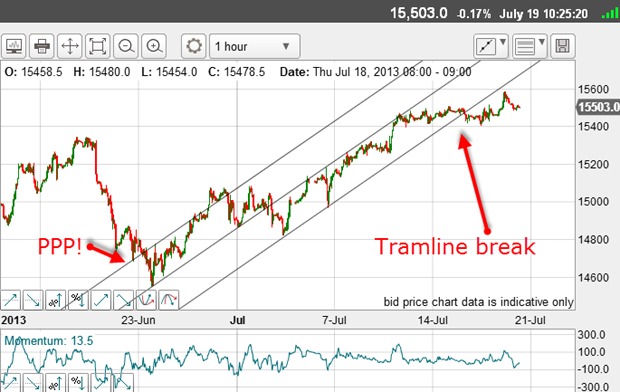
Indeed, we have a break of the lowest tramline yesterday. This could signal a trend change in this timeframe (but not necessarily in a longer timeframe). Note that after the break, the market rallied into new high ground but failed to break back above the line into the trading channel.
This was a classic kiss back to the line before the market peeled away again. The hit on the line wasn't perfect, but the action was. The tramline is now acting as resistance to rallies.
Let's take a second look
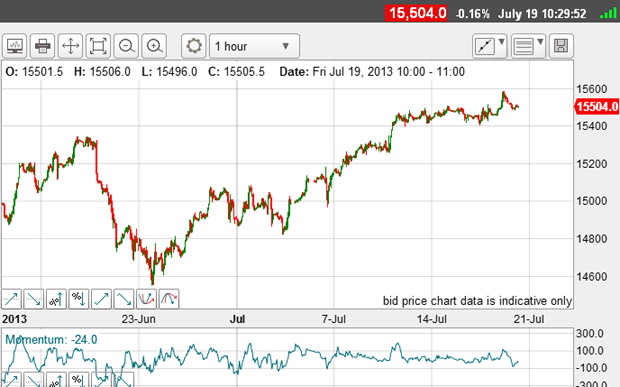
Are there alternative tramlines, with equally convincing placements?
Here is one alternative:
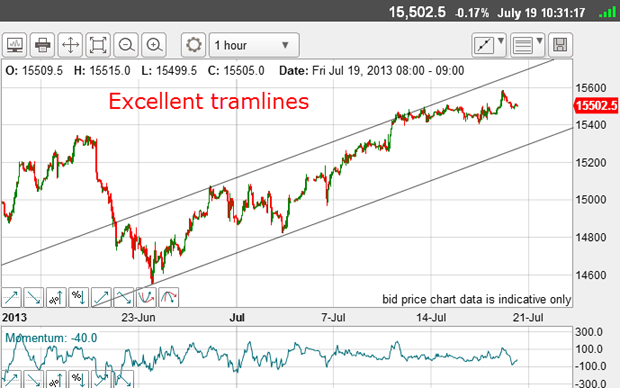
I have started from the 24 June low again and also used the 3 July low as my second touch point.
Then, I moved my parallel line up, and it crossed the significant highs on 27 June and 12 July. The important point is that this tramline pair describes the trading channel between 20 June and the present. At no time did trading take place outside this channel.
OK, these tramlines have a wide separation of almost 400 pips and are not very useful in timing swing trades.
Can I find another tramline between these two to guide my short-term trading?
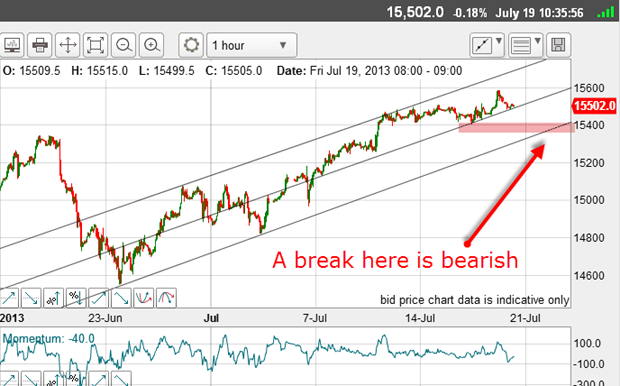
Yes, indeed. This centre line does cut through much trading, but the lows since Wednesday are lying on this line. I consider that to indicate the line is reliable.
A break of this line should indicate the market wants to trade below it, where the target would be the lower line in the 15,350 area.
So, I have two sets of tramlines working. The first has signalled a change of trend with the tramline break, and the second will do the same if the centre tramline is broken.
If this occurs, that will be added confirmation that a significant trend change is underway. Appropriate trades can therefore be taken when the tramlines are broken.
What's the long term scenario?
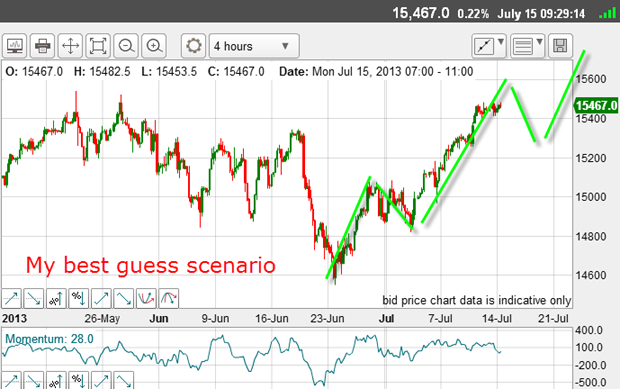
We appear to be completing wave 3 up prior to a decline into wave 4 (in a classic A-B-C?).
So a break of tramlines as outlined above would probably indicate that wave 4 was underway, where wave 4 would likely end at a Fibonacci retraceof the entire move up from the 23 June low.
My plan will be to enter my Fibonacci levels at any sign that the turn was at hand.
Short-term traders will be closely watching this probable decline.
Get the latest financial news, insights and expert analysis from our award-winning MoneyWeek team, to help you understand what really matters when it comes to your finances.
John is is a British-born lapsed PhD physicist, who previously worked for Nasa on the Mars exploration team. He is a former commodity trading advisor with the US Commodities Futures Trading Commission, and worked in a boutique futures house in California in the 1980s.
He was a partner in one of the first futures newsletter advisory services, based in Washington DC, specialising in pork bellies and currencies. John is primarily a chart-reading trader, having cut his trading teeth in the days before PCs.
As well as his work in the financial world, he has launched, run and sold several 'real' businesses producing 'real' products.
-
 MoneyWeek Talks: The funds to choose in 2026
Podcast Fidelity's Tom Stevenson reveals his top three funds for 2026 for your ISA or self-invested personal pension
-
 Three companies with deep economic moats to buy now
Opinion An economic moat can underpin a company's future returns. Here, Imran Sattar, portfolio manager at Edinburgh Investment Trust, selects three stocks to buy now