The gold market is still on a downward trend
The downward trend in gold is alive and well - but how low can it go? John C Burford uses his chart-trading methods to hunt out clues.
Get the latest financial news, insights and expert analysis from our award-winning MoneyWeek team, to help you understand what really matters when it comes to your finances.
You are now subscribed
Your newsletter sign-up was successful
Want to add more newsletters?

Twice daily
MoneyWeek
Get the latest financial news, insights and expert analysis from our award-winning MoneyWeek team, to help you understand what really matters when it comes to your finances.

Four times a week
Look After My Bills
Sign up to our free money-saving newsletter, filled with the latest news and expert advice to help you find the best tips and deals for managing your bills. Start saving today!
I last covered gold on 12 July when the market was staging a relief rally from the huge collapse it had suffered from April to June. In those few months it fell from $1,600 to under $1,200.
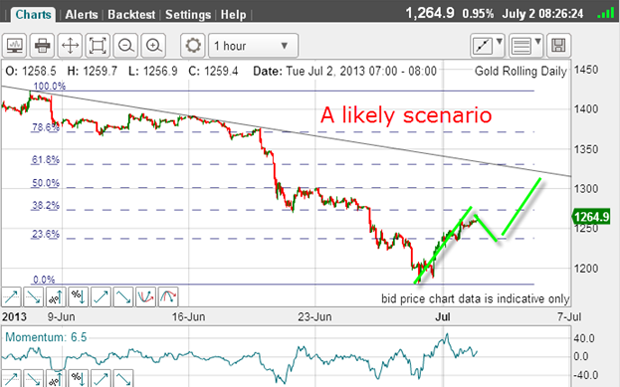
But after such a descent, a relief rally is normal (some call it a dead cat bounce). My best guess back then was for a rally above the $1,300 area in an A-B-C pattern, where the C wave would end in the region of the down-sloping trendline. This was the chart I showed then:
And this is how it has played out since then:
MoneyWeek
Subscribe to MoneyWeek today and get your first six magazine issues absolutely FREE

Sign up to Money Morning
Don't miss the latest investment and personal finances news, market analysis, plus money-saving tips with our free twice-daily newsletter
Don't miss the latest investment and personal finances news, market analysis, plus money-saving tips with our free twice-daily newsletter
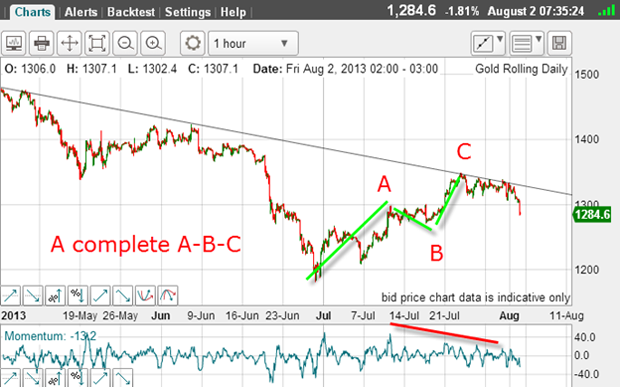
The market duly made a complex A-B-C, where the first minor three-wave pattern was in fact, the A wave of a larger pattern. Note the large negative-momentum divergence also (red bar).
Also, if we zoom in on the A and C waves, they each contain clear five-wave moves. Remember, when you can identify a fifth wave, that signals the markets are about to turn in a counter-trend move.
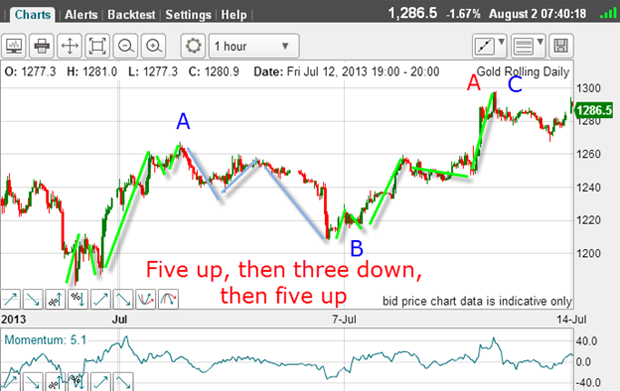
This is the structure of the A wave which is textbook.
Trader tip: When you suspect you have a C wave, look for a five-wave pattern within on the hourly or even 15-minute chart. And when you can spot a momentum divergence in your fifth wave compared with the third wave, you have a high-probability set-up for a reversal and a great trade.
And here is the C wave:
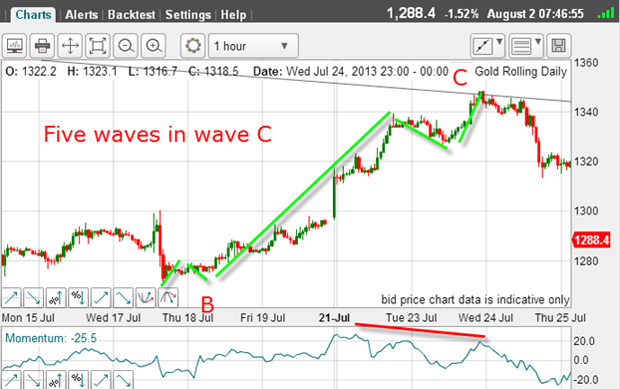
And we have a large negative-momentum divergence at the fifth wave top.
Incidentally, as the market fell below $1,200 in June, there was a potential positive-momentum divergence on the daily chart. That was our clue that the market was about to bottom.
But this Elliott wave analysis of the A-B-C relief rally means that the downtrend was very likely still in force and that the rally was presenting a shorting opportunity.
Finding the resistance zone
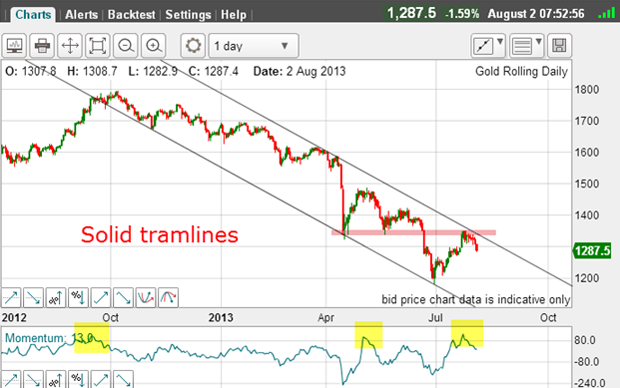
The lower tramline sports several excellent touch points with a prior pivot point (PPP). And this week, the market rallied to touch the upper tramline.
This is an area where we should expect resistance.
Also, there is additional massive overhead chart resistance in the $1,330 area (pink bar). This is where previous lows were made.
Trader tip: Where you see a major low that was made previously, this area often acts as a point of resistance to rallies. This is a great example here. And combined with an upper tramline hit, the resistance here should be formidable and a great place to enter short trade (the downtrend is still in force). These trades can be low risk, since you can place your protective stop just above the tramline.
But that is not all! Momentum at the C wave high was over-stretched. In a region where previous tops were made (yellow highlights), that was another reason to suspect the rally would run out of steam.
The bottom line is that the downtrend in gold is alive and well and if my tramlines are still operating, my medium-range target is back to test the lower tramline possibly in the $1,000 area.
As you know, I like to keep my eye on the commitments of traders (COT) data every week. Sadly, with the reports released on Fridays for the situation as of the previous Tuesday, the current report is out of date. But I believe it's instructive.
| (Contracts of 100 troy ounces) | Row 0 - Cell 1 | Row 0 - Cell 2 | Row 0 - Cell 3 | Open interest: 434,750 | ||||
| Commitments | ||||||||
| 161,197 | 127,006 | 25,291 | 210,233 | 244,929 | 396,721 | 397,226 | 38,029 | 37,524 |
| Changes from 07/16/13 (Change in open interest: -5,533) | ||||||||
| 4,626 | -6,103 | 2,220 | -12,513 | -2,424 | -5,667 | -6,307 | 134 | 774 |
| Percent of open in terest for each category of traders | ||||||||
| 37.1 | 29.2 | 5.8 | 48.4 | 56.3 | 91.3 | 91.4 | 8.7 | 8.6 |
| Number of traders in each category (Total traders: 297) | ||||||||
| 116 | 102 | 78 | 54 | 59 | 214 | 199 | Row 8 - Cell 7 | Row 8 - Cell 8 |
In the week ending July 23, the hedge funds (non-commercials) swung to the long side by a few percent.
If you look at the daily chart, that week saw gold in rally mode, rising $60 in the week.
This is additional proof that hedgies are largely trend-followers and mostly get caught out at market turns. Their abandoning of long positions on the way down to protect capital provides the fuel for sharp declines, as they hold the lion's share of the market.
That is why I love trading against the hedge funds!
With the market having turned down sharply this morning, I am quite sure this process is occurring as I write. The COT data for this week (to be released 16 August) will be revealing.
Market dopplegangers
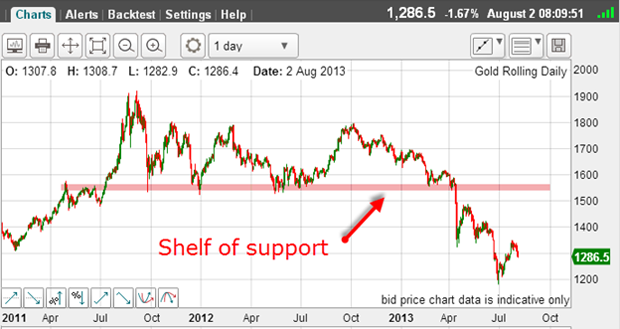
Here is the daily chart going back to early 2011, showing the famous all-time high at $1.920:
And here is the hourly chart for the past few days:
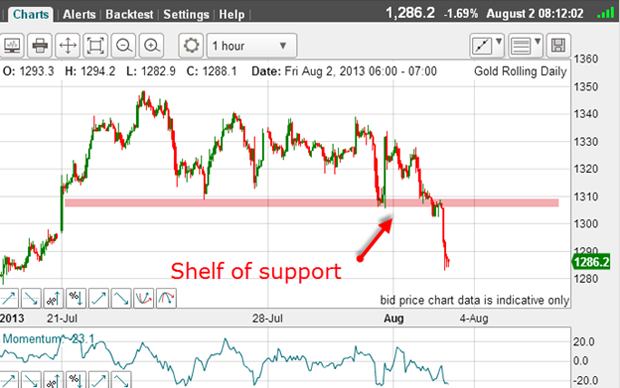
The waves above the two shelves are eerily similar, and we now have a break below on the hourly last night to match the daily.
Isn't that curious?
Make no mistake, markets are patterned, and it is our job to discover those patterns so that we can make accurate forecasts. The study of Elliott waves is extremely helpful here.
Get the latest financial news, insights and expert analysis from our award-winning MoneyWeek team, to help you understand what really matters when it comes to your finances.
John is is a British-born lapsed PhD physicist, who previously worked for Nasa on the Mars exploration team. He is a former commodity trading advisor with the US Commodities Futures Trading Commission, and worked in a boutique futures house in California in the 1980s.
He was a partner in one of the first futures newsletter advisory services, based in Washington DC, specialising in pork bellies and currencies. John is primarily a chart-reading trader, having cut his trading teeth in the days before PCs.
As well as his work in the financial world, he has launched, run and sold several 'real' businesses producing 'real' products.
-
 ISA fund and trust picks for every type of investor – which could work for you?
Whether you’re an ISA investor seeking reliable returns, looking to add a bit more risk to your portfolio or are new to investing, MoneyWeek asked the experts for funds and investment trusts you could consider in 2026
-
 The most popular fund sectors of 2025 as investor outflows continue
It was another difficult year for fund inflows but there are signs that investors are returning to the financial markets