Gold follows my game plan and rallies
Calling the bottom of a market has been likened to catching a falling knife. But if you follow these trading methods carefully, says John C Burford, you can keep yourself from getting hurt.
Get the latest financial news, insights and expert analysis from our award-winning MoneyWeek team, to help you understand what really matters when it comes to your finances.
You are now subscribed
Your newsletter sign-up was successful
Want to add more newsletters?

Twice daily
MoneyWeek
Get the latest financial news, insights and expert analysis from our award-winning MoneyWeek team, to help you understand what really matters when it comes to your finances.

Four times a week
Look After My Bills
Sign up to our free money-saving newsletter, filled with the latest news and expert advice to help you find the best tips and deals for managing your bills. Start saving today!
I was in Pisa last week, and found the statue of the great Fibonacci, where I paid my respects.
Taking a break from the markets can give me a fresh perspective on my return. Everyone should try it now and then.
But I have to say that my view on gold before I left has been playing out exactly as I thought it would. And on this occasion my perspective hasn't changed a bit.
MoneyWeek
Subscribe to MoneyWeek today and get your first six magazine issues absolutely FREE

Sign up to Money Morning
Don't miss the latest investment and personal finances news, market analysis, plus money-saving tips with our free twice-daily newsletter
Don't miss the latest investment and personal finances news, market analysis, plus money-saving tips with our free twice-daily newsletter
Let's review the situation in the gold market last month, when it was in freefall.
The decline was so severe that sentiment had plummeted. And as gold fell below the critical $1,200 level, there were a miniscule 3% bulls. This was very significant, and I mentioned it in my last post on gold.
In fact, this was the mirror image of the situation when gold made its all-time high of $1,920 in 2011. A reading of 3% bulls (or bears) means that all hope (or fear) has been abandoned by the majority, who have been driving the trend their way.
At the sub-$1,200 lows, there were precious few bullish articles. The overwhelming theme was "how low can gold go?"
When I read this, I just know at least a temporary low is near, as damage limitation has set in. That is a very negative emotion.
But most developing traders become swept up in the negative mood as prices plummet. They adopt the same 'how low can it go?' mentality. This is classic herding in action.
My advice is always take a step back from the high emotion and examine your charts rationally. In my last post on gold, I gave several good reasons (and charts) to suggest a low was near and that a long trade could well work out as the 97% of bears are likely to be squeezed.
Many see this tactic as akin to trying to catch a falling knife. Yes, with no solid evidence for a possible turn and working on just a hunch, buying a falling market is often a loser.
But sometimes, you can catch the knife by its handle!
A safe entry point

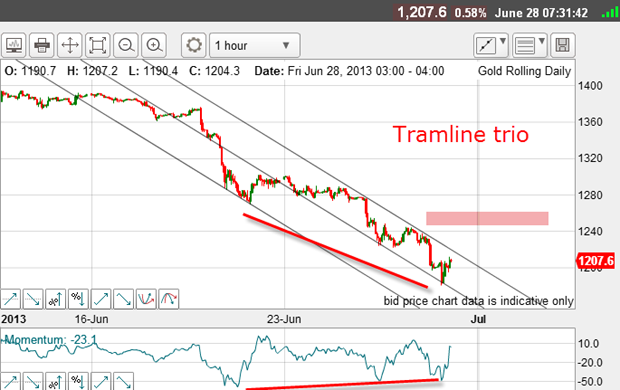
The first clue that the selling was drying up is the nice positive-momentum divergence (red bar). This is a classic sign of an impending counter-trend rally. It is your advance warning to prepare for a possible long trade.
And with my tramlines, you have a sensible entry point and crucially, a sensible position for your stop loss, thus giving you a known risk even before you enter the trade.
Armed with this data, you can then decide whether you wish to take this trade, or pass it up as having a risk that exceeds your established limit a limit that you will adhere to with discipline, I trust.
For instance, I have a 3% rule for smaller accounts no single trade will lose me over 3% of my capital. This is an iron-clad requirement and if it means passing up some trades, then so be it. There will always be another great trade coming along.
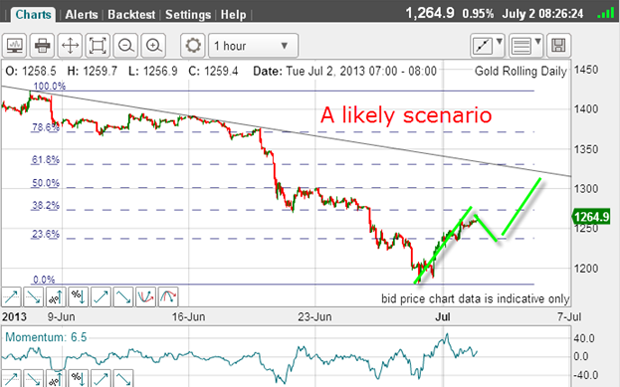
OK, just before I left for my break, the market was in rally mode. I made this projection on 2 July:

I believed the most likely scenario was an A-B-C formation as outlined in green. Was my forecast correct?
Yes. When you see a highly trending market, such as we had in gold, the most common form of relief rallies are A-B-Cs.
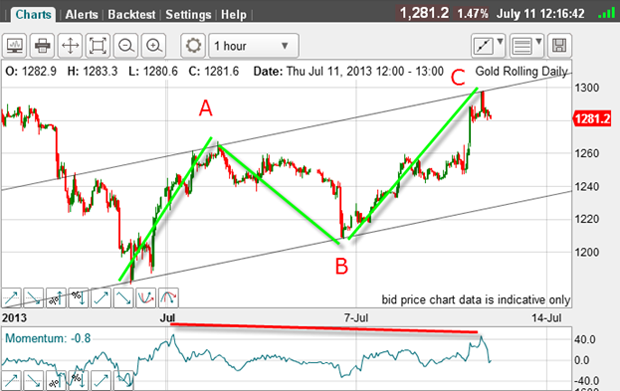
And yesterday, this was the situation:

And there it is - a lovely A-B-C with my tramlines showing that wave A = wave C as gold hit $1,298 yesterday and right on the tramline.
With a slight negative-momentum divergence at the C wave high, this was an ideal place to take profits off the table for a good 700-pip or so profit.
Since the market has now satisfied all Elliott wave requirements for the completion of the counter-trend rally, there is no longer any valid reason to hang on to long trades (for a swing trader, that is).
My next task is to identify my next trade.
Is it possible that the counter-trend rally has finished and the bear trend can resume? Certainly.
Easy money?
But if there was a large swing to a net short position, that could lend support to the rally. Let's see the latest data from 2 July:
| (Contracts of 100 troy ounces) | Row 0 - Cell 1 | Row 0 - Cell 2 | Row 0 - Cell 3 | Open interest: 410,399 | ||||
| Commitments | ||||||||
| 158,712 | 137,961 | 27,133 | 186,385 | 209,161 | 372,230 | 374,255 | 38,169 | 36,144 |
| Changes from 06/25/13 (Change in open interest: 19,752) | ||||||||
| -6,189 | 7,212 | 5,275 | 21,427 | 8,995 | 20,513 | 21,482 | -761 | -1,730 |
| Percent of open in terest for each category of traders | ||||||||
| 38.7 | 33.6 | 6.6 | 45.4 | 51.0 | 90.7 | 91.2 | 9.3 | 8.8 |
| Number of traders in each category (Total traders: 292) | ||||||||
| 115 | 95 | 72 | 61 | 54 | 209 | 193 | Row 8 - Cell 7 | Row 8 - Cell 8 |
The hedgies had a large net swing to add to their shorts, while the small traders took some short positions off the table.
This data was taken at the A wave high and so with the added spec shorts, the decline only took it to the B wave low before the rally resumed. No doubt we will see the hedgies adding even more shorts before the B wave low this data will be released later today.
I am quite sure the C wave rally surprised a lot of shorts as they expected a move towards their much-publicised lower targets.
I will examine the new COT data today for guidance, but the evidence so far points to an immediate decline off the $1,300 level. But the market certainly has the potential to stabilise and go on to make a larger A-B-C, after first dipping from current levels.
It appears the easy money has been made.
Get the latest financial news, insights and expert analysis from our award-winning MoneyWeek team, to help you understand what really matters when it comes to your finances.
John is is a British-born lapsed PhD physicist, who previously worked for Nasa on the Mars exploration team. He is a former commodity trading advisor with the US Commodities Futures Trading Commission, and worked in a boutique futures house in California in the 1980s.
He was a partner in one of the first futures newsletter advisory services, based in Washington DC, specialising in pork bellies and currencies. John is primarily a chart-reading trader, having cut his trading teeth in the days before PCs.
As well as his work in the financial world, he has launched, run and sold several 'real' businesses producing 'real' products.
-
 MoneyWeek Talks: The funds to choose in 2026
Podcast Fidelity's Tom Stevenson reveals his top three funds for 2026 for your ISA or self-invested personal pension
-
 Three companies with deep economic moats to buy now
Opinion An economic moat can underpin a company's future returns. Here, Imran Sattar, portfolio manager at Edinburgh Investment Trust, selects three stocks to buy now