Has the gold price turned the corner?
Gold is in freefall, down over $700 from its 2011 high. But, says John C Burford, the charts suggest a major low is near. So is gold about to turn?
Get the latest financial news, insights and expert analysis from our award-winning MoneyWeek team, to help you understand what really matters when it comes to your finances.
You are now subscribed
Your newsletter sign-up was successful
Want to add more newsletters?

Twice daily
MoneyWeek
Get the latest financial news, insights and expert analysis from our award-winning MoneyWeek team, to help you understand what really matters when it comes to your finances.

Four times a week
Look After My Bills
Sign up to our free money-saving newsletter, filled with the latest news and expert advice to help you find the best tips and deals for managing your bills. Start saving today!
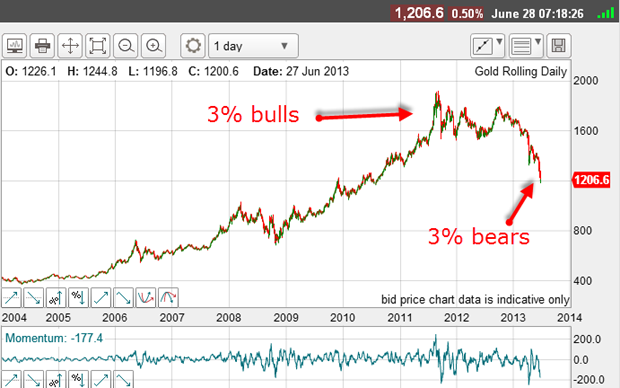
Gold is tanking. It's now down over $700 from its 2011 high. The most recent significant high was the $1,800 top last October, and now it has fallen by $600 to the $1,200 level in just nine months.
This daily chart shows the carnage:

I've been bearish on gold for a long time. When I wrote about gold earlier in the year, I got a lot of criticism. Commenters questioned my sanity for being so negative towards gold. I enjoyed them all!
MoneyWeek
Subscribe to MoneyWeek today and get your first six magazine issues absolutely FREE

Sign up to Money Morning
Don't miss the latest investment and personal finances news, market analysis, plus money-saving tips with our free twice-daily newsletter
Don't miss the latest investment and personal finances news, market analysis, plus money-saving tips with our free twice-daily newsletter
Those who were bullish believed that quantitative easing (QE) money creation would automatically stoke a hyperinflation. And gold is believed to be a hedge against inflation. Therefore, gold must go up. QED.
It was a persuasive argument on the surface. But it failed to notice that far from consumer inflation rising, the actual trend was a mild disinflation since 2008. Hyperinflation never happened.
And anyway, gold is not always an inflation hedge, as is commonly believed. For instance, in the 1980s gold was in a bear market, yet consumer price inflation (CPI) was rising!
As with all easy to digest market myths, its veracity depends on other circumstances. Sometimes it works, sometimes it doesn't.
But to my mind, the market was in a classic bubble as it rose to its 2011 top at $1,920. The price had far outstripped the increase in consumer prices since the big rally accelerated around 2002. If it was acting as an inflation hedge, it was certainly turbo-charged.
One other factor I used to make my bearish judgment was the sentiment readings. At important tops, sentiment is always extremely bullish. The soon-to-be bear market must have fuel for its decline and the more bulls there are on board compared with bears, the faster the decline.
At this 2011 peak, typical DSI (the daily sentiment index at trade-futures.com, which is a poll of professional traders) rose to 97% bulls. Only 3% were bearish.
When I see such a consensus, I am always amazed that so many can be lured into the same viewpoint. In most things in life, there is a much more evenly balanced range of views (politics is one such arena).
But the human mind is a strange thing! This consensus makes market manias. There are some great books on the mania phenomenon, but when you see it in front of your own eyes in real time, it is a wonder to behold.
Back to 2010
All of the gains of the last three years have been wiped out. To die-hard gold fans, this must be a disappointment.
But guess what, the market this morning seems to be in a mirror-image of the run-up in 2011. That is why I have referred to the run-up to the 2011 top in such detail.
We now have a market in freefall (in 2011, it was in freerise, if I can coin that term).
And the DSI reading is 3% bulls now (in 2011, it was 3% bears).
The current mantra is this: long-term interest rates are on the rise and so holding gold will cost more in interest charges. And stocks are the market to be in, inflation is falling - so why hold gold?
What does this suggest?
To me, there is only one conclusion with merit when the current selling capitulation is complete, the market will stage a vigorous rally. When the market begins this rally, masses of buy-stops will be triggered by shorts anxious to lock in their massive profits. Prices will then rise as the excess negativity is worked off. Markets are always seeking balance.
Can we use the charts to attempt to find the gold bottom? Let's try.
First, it is clear that the waterfall selling recently seen is a pure long capitulation in other words, panic selling by the bulls who have bought gold in the last three years and are now throwing in the towel. Remember, this was the period when gold fever was at its height (up to 2011/2012) and attracted the last hold-outs.
These last-minute buyers had been watching the price zoom upwards while the US Federal Reserve ramped up its QE operations until finally, they couldn't take it anymore and made their move.
The moral of the story is, if you are going to join a bandwagon, you had better get on early. And if you are going to panic as the price collapses, better to panic early.
Is this the bottom?

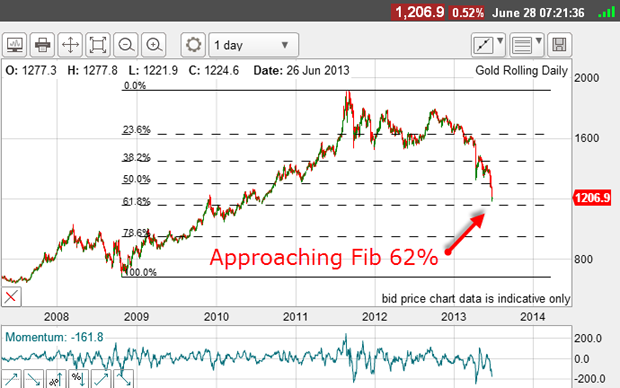
The market low last night was at the $1,180 level, which is close to the Fibonacci 62% retrace of the move from the significant low of late 2008.
Can we expect a major low at any time now?
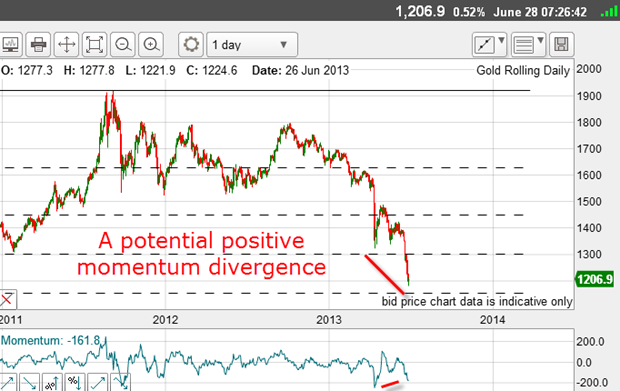
Note there is a potential large positive momentum divergence:

This means the selling force is weakening.
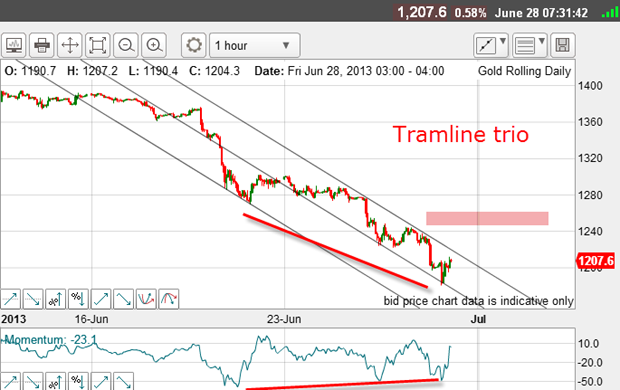
And one final point: On the hourly chart, I have a nice tramline trio:

At yesterday's low, there is a positive momentum divergence. And if the market can break above the upper tramline and into the pink zone, the short covering should pick up.
Putting all of this together, I can make a very good case that a major gold low is in, or is very near.
Get the latest financial news, insights and expert analysis from our award-winning MoneyWeek team, to help you understand what really matters when it comes to your finances.
John is is a British-born lapsed PhD physicist, who previously worked for Nasa on the Mars exploration team. He is a former commodity trading advisor with the US Commodities Futures Trading Commission, and worked in a boutique futures house in California in the 1980s.
He was a partner in one of the first futures newsletter advisory services, based in Washington DC, specialising in pork bellies and currencies. John is primarily a chart-reading trader, having cut his trading teeth in the days before PCs.
As well as his work in the financial world, he has launched, run and sold several 'real' businesses producing 'real' products.
-
 Average UK house price reaches £300,000 for first time, Halifax says
While the average house price has topped £300k, regional disparities still remain, Halifax finds.
-
 Barings Emerging Europe trust bounces back from Russia woes
Barings Emerging Europe trust has added the Middle East and Africa to its mandate, delivering a strong recovery, says Max King