Gold follows the tramlines lower
In a bear market, the trend is your friend, says John C Burford. Here, he uses his trading methods to track gold's downward trajectory.
Get the latest financial news, insights and expert analysis from our award-winning MoneyWeek team, to help you understand what really matters when it comes to your finances.
You are now subscribed
Your newsletter sign-up was successful
Want to add more newsletters?

Twice daily
MoneyWeek
Get the latest financial news, insights and expert analysis from our award-winning MoneyWeek team, to help you understand what really matters when it comes to your finances.

Four times a week
Look After My Bills
Sign up to our free money-saving newsletter, filled with the latest news and expert advice to help you find the best tips and deals for managing your bills. Start saving today!
If you're trying to make money using my methods, do please read today's issue.
I'm following up on my last gold article from 11 July to help you see these tools in action. Gold right now is a great market to learn from.
That's because it clearly illustrates how I use the three pillars in my methodology Elliott wave analysis, Fibonacci retracements and tramlines to identify low-risk trades.
MoneyWeek
Subscribe to MoneyWeek today and get your first six magazine issues absolutely FREE

Sign up to Money Morning
Don't miss the latest investment and personal finances news, market analysis, plus money-saving tips with our free twice-daily newsletter
Don't miss the latest investment and personal finances news, market analysis, plus money-saving tips with our free twice-daily newsletter
As you know by now, I'm treating gold as in a bear market for my swing trading purposes. The all-time highs were made about a year ago at $1,920, and the market has been working lower ever since, albeit with very wide swings.
If you've been following MoneyWeek Trader in the past year, you've seen how I've been trading it successfully from the short side. And until conditions change, I will continue in this vein
Why I favour the downside on gold
That's not to say that there are no swing trading opportunities on the long side in gold. Of course there could be. But I will say that in a bear market, since the trend is your friend, better results can be expected from the short side.
Also, even a quick glance at the charts will confirm that declines are most often sharper than rallies.
As is sometimes said, gold can fall out of the window faster than it can climb the stairs.
And if I can capture a decent swing on the downside quickly, I can release that capital to search for more trades.
Note that I have not mentioned a word about fiat currencies! I understand the rationale of the bulls' argument that recent money-printing has guaranteed' a loss of their value against the gold price. That's fair enough.
But what they do not take into account is the massive debt worldwide that requires servicing, which is deflationary and will at least partially cancel out or swamp the inflationary effects.
The bottom line is that successful traders do not hitch themselves to any particular wagon in terms of the fundamentals. That's key.
I watch the sentiment readings, and when sentiment reaches an extreme either bullish or bearish that is when I start to look for opposite trades. That way, I can often identify lows and highs to take my low-risk trades.
But please don't get me wrong. For an individual investor, for insurance purposes as distinct from swing trading holding physical gold makes a lot of sense. Remember, MoneyWeek Trader is about trading. But if you have a strong view on gold, leave a comment at the end of the article.
How my last short trade worked out
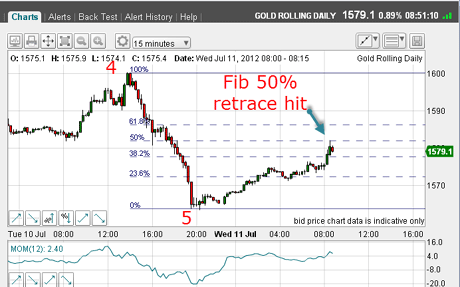
OK, let's get back to the charts. Recall that last time I had identified another shorting opportunity:
(Click on the chart for a larger version)
The market had retraced a Fibonacci 50% and was teed up for my trade in the $1,580 area. My stop was placed just above the Fibonacci 62% level at the $1,585 level for a very low-risk $5 maximum loss to my stop.
Let's see how it panned out:
(Click on the chart for a larger version)
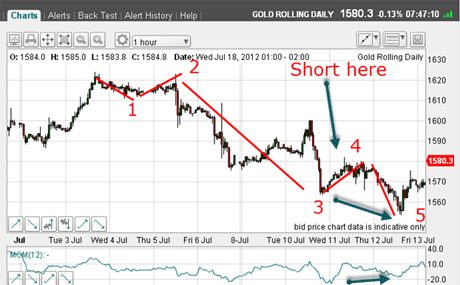
The market did decline off the $1,580 area and made a new low below $1,560.
Now, I needed to revise my Elliott wave count with this new low and at my new wave 5 low, there is a large positive momentum divergence, indicating a weakening of the selling pressure.
That was a good place to scurry for the exit! After five waves down comes a corrective rally, hopefully in an A-B-C format. And that is what I was looking for.
This is this morning's chart:
(Click on the chart for a larger version)
This chart contains several important points.
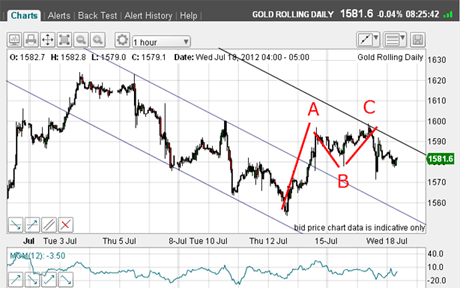
1. When the market embarked on its strong rally last Friday, I decided to look for tramlines. I drew in the central one first, capturing the important highs of 5 and 10 July. I then drew the lowest one, which was not altogether satisfactory, but let it go for now. Then the highest one and yesterday, the market bounced off it very sharply.
2. The rally is in a clear A-B-C with a negative momentum divergence at the C wave high. This is strong evidence for a turn, which occurred.
3. The decline yesterday moved below my B wave low, confirming the short-term trend is now down.
So a short anywhere near the C wave top was a good candidate for a low-risk trade.
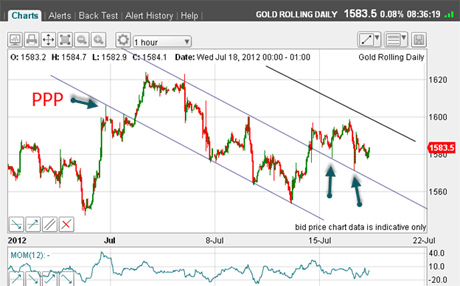
But then, I had another look and discovered another set of tramlines which I think is more satisfactory:
(Click on the chart for a larger version)
My lowest tramline has a nice prior pivot point (PPP), and contains three superb touch-points. And the break up through the centre tramline was followed by two pull-back kisses (green arrows).
My maximum target is thus the highest tramline, which lies just below my C wave top.
Trader tip: You can often find competing tramline sets on the same chart. My first attempt was not entirely satisfactory but it did identify yesterday's high, so it is significant. My second set is prettier, but will it be just as valid? Time will tell.
But are there any shorter-term tramlines that give me some more clues?
Gold is heading down but watch the wedge pattern
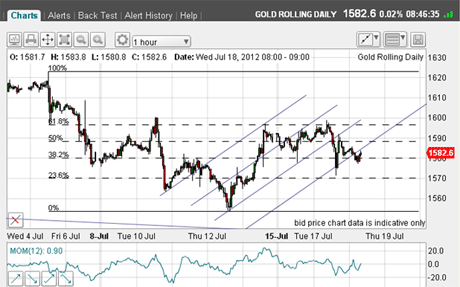
Take a look at this as we zoom in on the last ten days:
(Click on the chart for a larger version)
This is a close-up of the rally and indeed I have found four good up-sloping tramlines.
Note also that the C wave top occurred at the Fibonacci 62% retrace, as shown another reason to look for a top there and a shorting opportunity.
Why not go over this chart yourself to find the PPPs, the kisses, and look for possible low-risk entries?
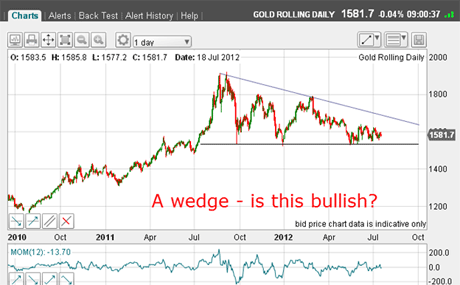
The market appears this morning to be heading towards my long-standing $1,530 target area. But I always keep a weather eye on the bigger picture:
(Click on the chart for a larger version)
I'm sure all the gold bulls have spotted this potential wedge pattern! Of course, an upward break above the upper line would be bullish but we are about $100 beneath at present.
For now, all I can say is that we are trading between the lines, and a break of either would send the pigeons flying! Meanwhile, I will try to capture the swings on the downside.
Do you have a view on gold? And are you prepared to trade it from both the long and the short side? Please share your thoughts below.
If you're a new reader, or need a reminder about some of the methods I refer to in my trades, then do have a look at my introductory videos:
The essentials of tramline trading
An introduction to Elliott wave theory
Advanced trading with Elliott waves
Don't miss my next trading insight. To receive all my spread betting blog posts by email, as soon as I've written them, just sign up here .
Get the latest financial news, insights and expert analysis from our award-winning MoneyWeek team, to help you understand what really matters when it comes to your finances.
John is is a British-born lapsed PhD physicist, who previously worked for Nasa on the Mars exploration team. He is a former commodity trading advisor with the US Commodities Futures Trading Commission, and worked in a boutique futures house in California in the 1980s.
He was a partner in one of the first futures newsletter advisory services, based in Washington DC, specialising in pork bellies and currencies. John is primarily a chart-reading trader, having cut his trading teeth in the days before PCs.
As well as his work in the financial world, he has launched, run and sold several 'real' businesses producing 'real' products.
-
 Average UK house price reaches £300,000 for first time, Halifax says
While the average house price has topped £300k, regional disparities still remain, Halifax finds.
-
 Barings Emerging Europe trust bounces back from Russia woes
Barings Emerging Europe trust has added the Middle East and Africa to its mandate, delivering a strong recovery, says Max King