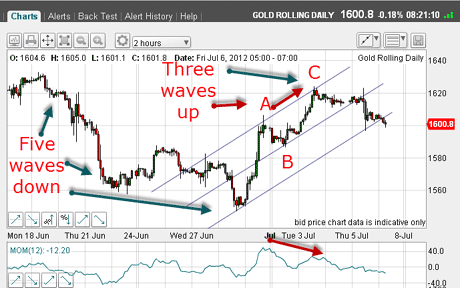
In Friday's article, I detailed how the five-wave pattern down from the 19 June high to the 28 June low, followed by the three-wave A-B-C rally to the 3 July high confirmed that the most likely path for gold was down and that it would probably challenge the critical $1,530 support area fairly soon.
Since then, the market is making solid headway to this target, so let's recap what the picture looked like on Friday.
From the $1,623 wave C high, I could draw in a solid tramline trio on the two-hour chart below.
Try 6 free issues of MoneyWeek today
Get unparalleled financial insight, analysis and expert opinion you can profit from.

Sign up to Money Morning
Don't miss the latest investment and personal finances news, market analysis, plus money-saving tips with our free twice-daily newsletter
Don't miss the latest investment and personal finances news, market analysis, plus money-saving tips with our free twice-daily newsletter
A break of the central tramline let me in with a short entry in the $1,615 region with my protective stop just above the $1,623 high.

(Click on the chart for a larger version)
Trader tip: This is a great example of how I am able to locate low-risk entries in this case, a stop of less than $10 (100 pips). For the notoriously spiky' nature of this market, this is a very close stop! To illustrate what this means, suppose I had allocated a maximum risk of 3% of my account of, let's say £20,000, or £600. Risking 100 pips means that I could bet £600/100 = £6 per pip and stay within my money management rule.
This is a very simple method of calculating the maximum allowed size of any bet on any trade.
By doing this calculation on every trade, you need have no worries about keeping to your discipline it is done automatically for you provided you remember to actually enter your protective stop.
Gold is following my Elliott wave roadmap perfectly
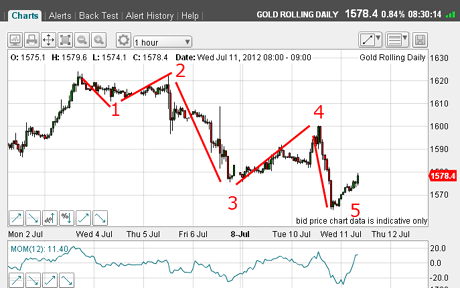
OK, with my bearish analysis being supported in the short-term, has the market confirmed my stance? If we are truly resuming the bear market, the next move down should bear the hallmarks of another five-wave pattern.
Do we have one?
Here is the hourly chart as of this morning:
(Click on the chart for a larger version)
Yes, indeed a five-wave move down! Nice.
So this gives me added confidence in my roadmap.
Note also that the corrective 4 wave has a splendid A-B-C character this is even more confirmation of my Elliottwave labels.
Now with the market having moved down by around $50, I moved my protective stop down to break-even, following my break-even rule.
I now have a free ride on this trade.
Naturally, after a five-wave pattern comes a three-wave correction. And that is what I will be looking for in the next few hours.
Of course, nothing is written in stone in forecasting, so where would the market have to go in order for me to cancel out this picture?
If the market can move much above the wave 4 high at the $1,600 area, I would need to go back to the drawing board. But with the Elliott waves lining up as well as they have so far, I put this event at a lower probability, but not zero!
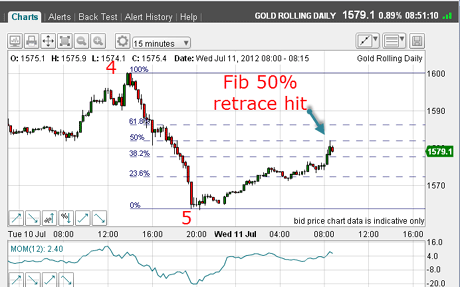
And before I go, here is the latest chart as of 9am:
(Click on the chart for a larger version)
We have a lovely Fibonacci 50% retrace of wave 5 hit a moment ago another great place I could have entered a short trade using a 3% protective stop, of course.
If you're a new reader, or need a reminder about some of the methods I refer to in my trades, then do have a look at my introductory videos:
The essentials of tramline trading
An introduction to Elliott wave theory
Advanced trading with Elliott waves
Don't miss my next trading insight. To receive all my spread betting blog posts by email, as soon as I've written them, just sign up here .