Has gold topped for 2012?
Gold's market rally has stalled. And the charts are showing 'textbook' Elliott waves which spell trouble for the gold price, says spread betting expert John C Burford.
Get the latest financial news, insights and expert analysis from our award-winning MoneyWeek team, to help you understand what really matters when it comes to your finances.
You are now subscribed
Your newsletter sign-up was successful
Want to add more newsletters?

Twice daily
MoneyWeek
Get the latest financial news, insights and expert analysis from our award-winning MoneyWeek team, to help you understand what really matters when it comes to your finances.

Four times a week
Look After My Bills
Sign up to our free money-saving newsletter, filled with the latest news and expert advice to help you find the best tips and deals for managing your bills. Start saving today!
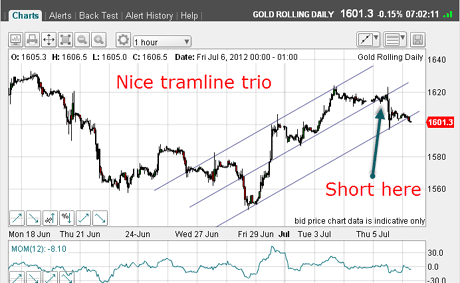
In yesterday's MoneyWeek Trader,I left you with the comment that I could see some interesting things on the short-term gold chart.
Take a look and I'll talk you through what I mean:

(Click on the chart for a larger version)
MoneyWeek
Subscribe to MoneyWeek today and get your first six magazine issues absolutely FREE

Sign up to Money Morning
Don't miss the latest investment and personal finances news, market analysis, plus money-saving tips with our free twice-daily newsletter
Don't miss the latest investment and personal finances news, market analysis, plus money-saving tips with our free twice-daily newsletter
As I was writing that issue yesterday morning, gold was trading just under the $1,620 level, near the tip of my green arrow. I could then draw in my first tramline across Monday's low.
A parallel line above took in the recent highs, including Tuesday's $1,623 high, and the equidistant parallel line beneath very conveniently crossed the major $1,550 low. How about that?
Three tramlines that show solid support and resistance
These solid touch-points have given me confidence that these tramlines really do represent solid support and resistance at least in the near-term which is the fundamental value of tramlines.
That is powerful information to have knowing when (in time) and where (in price) the market is likely to reach and then to bounce. Are you using this yet in your own analysis? Let me know in the comments at the end.
So with my tramlines in place yesterday morning, the market later on did break through the centre tramline, where I was waiting with my short sell orders.
The market then broke quite sharply, but where did it stop falling? Right on my lowest tramline, of course! How pretty is that?
With tramlines in place, anyone with this information could have forecast this. This is the power of tramlines!
Isn't it great to have a forecasting tool that is simple to use and can be generated in a flash on your charts? No expensive software, no black boxes, and no waiting! That's what these techniques can do for you and that's what I'll be focusing on in my upcoming workshop.
What the charts are saying about the big picture for gold
OK, I then expected a bounce of some sort but it has been weak (so far) and as I write, the market is attempting to break below my lowest tramline in the $1,600 area.
So how does this action fit into the bigger picture for gold?
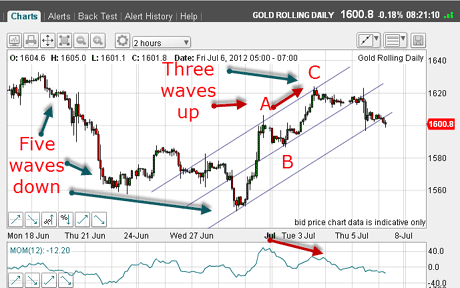
Remember that I had pencilled in Elliott wavelabels for the decline off the 19 June $1,632 top to the $1,550 low and I found five clear waves down.
With that correctly identified, I managed to take my latest swing profit near the $1,550 low as it was in the fifth (ending) wave.
Now, to confirm my labelling, any rally had to stop short of the $1,632 high. A push above that level would cancel out my forecast for a big move down because my five-wave labels would be wrong.
Trader tip: Do understand that this is no mere theoretical fancy! If the market rallies above the $1,632 high, it would indicate further strength ahead. The $1,632 level thus is acting as the line in the sand and is the definitive marker for either a bullish or a bearish stance.
Not many methods of analysis can give you so clear an answer bullish or bearish! That is just one of the many benefits of learning Elliott waves and that's why I cover them in my workshops. I strongly recommend you learn to use Elliott waves in your trading.
Textbook Elliott waves spell trouble for gold
So far, the market rally has stopped short of the $1,632 level, and also has an A-B-C form with a negative momentum divergence at the C wave high (red arrows on the chart below):

(Click on the chart for a larger version)
This is playing as a textbook Elliott wave market motive swings (those in the direction of the larger trend) possess five waves in that direction with three counter-trend waves.
If I'm correct, the $1,632 level should hold and the market should now head down towards the critical $1,530 support zone I have shown in previous gold articles.
And that implies that we have seen the highs in gold for a very long time, and this action here described will help answer the question in my headline.
So $1,530 is my main target on gold for now.
Of course, a move above $1,632 would radically alter this scenario! But with the Elliott waves lining up as they do, this is less likely.
By the way, I stress again: I'm not giving trade recommendations here. These are my thoughts and trades and I'm using them to show you my methods. I hope that by following them, you'll be able to find your own trades. And if you'd like some higher level education, do consider my next workshop. Details coming soon.
That's all for this week. Do let me know if you have any thoughts or comments on this issue here.
Have a great weekend.
If you're a new reader, or need a reminder about some of the methods I refer to in my trades, then do have a look at my introductory videos:
The essentials of tramline trading
An introduction to Elliott wave theory
Advanced trading with Elliott waves
Don't miss my next trading insight. To receive all my spread betting blog posts by email, as soon as I've written them, just sign up here .
Get the latest financial news, insights and expert analysis from our award-winning MoneyWeek team, to help you understand what really matters when it comes to your finances.
John is is a British-born lapsed PhD physicist, who previously worked for Nasa on the Mars exploration team. He is a former commodity trading advisor with the US Commodities Futures Trading Commission, and worked in a boutique futures house in California in the 1980s.
He was a partner in one of the first futures newsletter advisory services, based in Washington DC, specialising in pork bellies and currencies. John is primarily a chart-reading trader, having cut his trading teeth in the days before PCs.
As well as his work in the financial world, he has launched, run and sold several 'real' businesses producing 'real' products.
-
 Average UK house price reaches £300,000 for first time, Halifax says
While the average house price has topped £300k, regional disparities still remain, Halifax finds.
-
 Barings Emerging Europe trust bounces back from Russia woes
Barings Emerging Europe trust has added the Middle East and Africa to its mandate, delivering a strong recovery, says Max King