Big trading lessons from Barclays
With the Libor debacle, Barclays has been all over the news this week. And it's providing spread betters with some great trading lessons, says John C Burford.
Get the latest financial news, insights and expert analysis from our award-winning MoneyWeek team, to help you understand what really matters when it comes to your finances.
You are now subscribed
Your newsletter sign-up was successful
Want to add more newsletters?

Twice daily
MoneyWeek
Get the latest financial news, insights and expert analysis from our award-winning MoneyWeek team, to help you understand what really matters when it comes to your finances.

Four times a week
Look After My Bills
Sign up to our free money-saving newsletter, filled with the latest news and expert advice to help you find the best tips and deals for managing your bills. Start saving today!
With the Libor debacle, Barclays has been all over the news this week. So I thought I'd check in on the chart I put up on the screen at the MoneyWeek conference in April.
And as I'll show you, the latest action shows us some great trading lessons!
In my presentation, I showed the Barclays chart as a classic example of how to trade with Fibonacci and Elliott wavesin a large cap stock.
MoneyWeek
Subscribe to MoneyWeek today and get your first six magazine issues absolutely FREE

Sign up to Money Morning
Don't miss the latest investment and personal finances news, market analysis, plus money-saving tips with our free twice-daily newsletter
Don't miss the latest investment and personal finances news, market analysis, plus money-saving tips with our free twice-daily newsletter
That's a rare departure for me as you know, I normally stick to gold, the euro and the Dow! (Keep reading for my latest on gold)
Barclays sticks to the Fibonacci levels
But bear with me. This latest Barclays chart action is very timely and instructive. So let's have a look at the situation back in March:
(Click on the chart for a larger version)
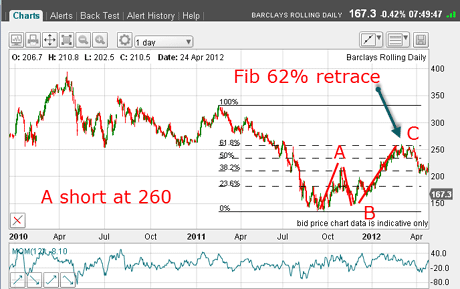
The market had fallen to the 135p area last October and was staging a relief rally in the classic A-B-C format. Using the latest significant high at the 330p level in February as my high pivot point, I then applied my Fibonacci tool to this decline.
When the market hit the precise 62% retrace and looked like completing the C wave, that was the time to place a low-risk short trade.
A near-perfect set-up: since, in addition, there was heavy chart resistance at 260p provided by the lows formed in 2010.
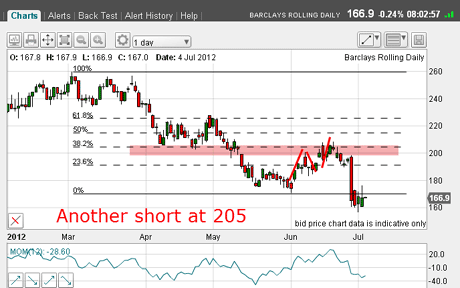
But that's not all! The market then declined to 170p on 1 June a fall of 900 pips, or a substantial profit of £900 on each £1 bet and then recovered:
(Click on the chart for a larger version)
The rally carried to the Fibonacci 38% retrace in another A-B-C and ran into chart resistance (pink bar).
This was another set-up for a low-risk short at the 205p level. And we all know what occurred over the last few days with bank shares being hammered.
The most difficult part of trading
Now with really bad news out in the open, has the market discounted it enough and is it ready to rally? If a trader believed this, they might be tempted to take profits here. After all, shorting at 260p in March, they'd be looking at a 1,000 pip profit in only four months.
If, on the other hand, they believed there was more downside, the trader would hold.
And that brings me to a basic point in trading. By using my (or any other) method, you can get into a trade and I showed two excellent low-risk entries here - but how do you handle it from there?
I often think that getting into a trade is the easy part how you manage it is the most difficult.
One reason for this is the fact that you do not know how the market will play after your entry. It could go straight in your direction, or it could zig and zag around going nowhere, or it could reverse and stop you out (that's the easiest decision out of the way!)
Something you need to think about before you trade
As a trader, you must decide which style of trade management suits your own personality before you begin serious trading. To my mind, there are three basic trader types:
Trader 1 The Scalper
You are quick to grab a profit when you see one, scared that this gain will be wiped out by any adverse move that could come at any time out of the blue. You take many small losses and perhaps not so many small gains. This is called scalping' and most fail at it. I do not recommend it.
Trader 2 The Bombproof Trader
You are much more sanguine and will hold the trade so long as your original stop isn't hit and ride it through often sharp reversals. You are a buy-and-hold (or short-and-hold) trader. You know you run the risk of seeing a large profit wiped out if the market turns, but you do hit a home run every now and then. You are generally emotionally tied to your positions.
Trader 3 The Swinger
You trade the larger swings, either up or down. You have no problem exiting a good trade when you believe a reversal is near. You do not have a rigid view of where the market is headed and are not married to your trade you are flexible and use proven methods using your charts as your prime signal generator for action.Your approach to trading is business-like and you accept losses as a business cost, not a personal attack by anyone. Your goal is to build your account up by a series of decent profits over time, preferably several years. Your motto is: 'Trading is a marathon, not a sprint'.
If you have not yet done so, I highly recommend that you examine yourself and your character to see which type of trading is best suited. This is not an easy exercise for many!
And if you are not achieving success yet, maybe it is because you have not found the trading style that you can profitably use.
But whichever style you adopt, the key rule is: preservation of capital using time-tested money management rules.
In these articles, I am showing the methods I use to enter trades and also how I exit them; win, lose or draw. I try to apply my rules consistently in every trade, but we are all human!
By the way, I'm planning another workshop soon. If you come along, I'll teach you and a handful of other traders how you could make serious gains using my methods. If you're interested, get your name down. I'd love to show you. I'll let you know when I have more details.
For now, let's check in on old gold
Gold rallies back to my tramline
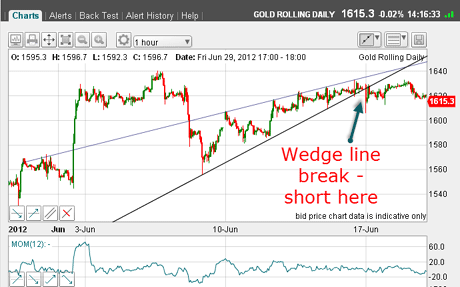
Last timeI wrote about goldon 15 June , I was waiting for either a push above my long-term tramline (see later), or a break of my wedge, which I expected to resolve downwards:
(Click on the chart for a larger version)
Right after I wrote that, we got the downward break and a short trade was initiated in the $1,620 region (with a 3% stop, of course).
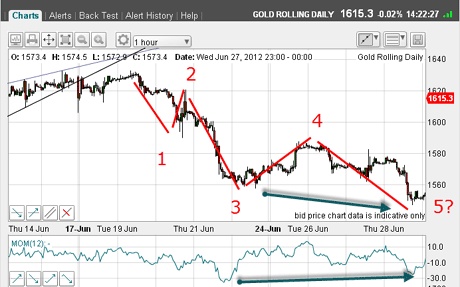
Following the failed attempt to get back to the line to make a kiss' which indicated weakness the market broke sharply in five clear waves:
(Click on the chart for a larger version)
Note also the potential positive momentum divergence(green arrows). Those were great reasons to take profits on that swing down to the fifth wave!
So that was a nice $70 per oz profit, or £700 per £1 bet.
After five waves down comes yes, three waves up (or variation). So that's what I expected.
But then, I had no clue to tell me how high the rally would carry, so I stayed away from a long trade. Pity, because it was a doozy and has carried right back to my long-term tramline:
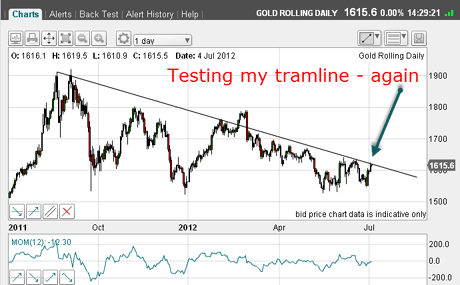
(Click on the chart for a larger version)
Will it break through this time, or will it bounce away again, as it has previously? We'll need to wait and see, of course.
But just gazing at the daily chart confirms that my policy of catching the swings is the correct one for me. A buy-and-hold trader/investor has made absolutely nothing in 12 months, while I have made numerous profitable swing trades (and a few losers), which I have detailed in my emails.
A buy-and-hold investor has had to sit through some gut-wrenching thrills and spills, especially if leveraged. I'm too much of a coward for that approach!
And as I write this morning, I can spot some interesting features on the shorter-term gold chart. On Friday, I hope to continue the gold story, as the market is again at a critical juncture.
Stay tuned! And if you have any thoughts or questions before then, leave them below.
If you're a new reader, or need a reminder about some of the methods I refer to in my trades, then do have a look at my introductory videos:
The essentials of tramline trading
An introduction to Elliott wave theory
Advanced trading with Elliott waves
Don't miss my next trading insight. To receive all my spread betting blog posts by email, as soon as I've written them, just sign up here .
Get the latest financial news, insights and expert analysis from our award-winning MoneyWeek team, to help you understand what really matters when it comes to your finances.
John is is a British-born lapsed PhD physicist, who previously worked for Nasa on the Mars exploration team. He is a former commodity trading advisor with the US Commodities Futures Trading Commission, and worked in a boutique futures house in California in the 1980s.
He was a partner in one of the first futures newsletter advisory services, based in Washington DC, specialising in pork bellies and currencies. John is primarily a chart-reading trader, having cut his trading teeth in the days before PCs.
As well as his work in the financial world, he has launched, run and sold several 'real' businesses producing 'real' products.
-
 Average UK house price reaches £300,000 for first time, Halifax says
While the average house price has topped £300k, regional disparities still remain, Halifax finds.
-
 Barings Emerging Europe trust bounces back from Russia woes
Barings Emerging Europe trust has added the Middle East and Africa to its mandate, delivering a strong recovery, says Max King