The line that marks the danger zone for gold bulls
John C Burford pinpoints two critical levels for gold as it approaches the danger zone, and foresees major volatility ahead in the market.
Get the latest financial news, insights and expert analysis from our award-winning MoneyWeek team, to help you understand what really matters when it comes to your finances.
You are now subscribed
Your newsletter sign-up was successful
Want to add more newsletters?

Twice daily
MoneyWeek
Get the latest financial news, insights and expert analysis from our award-winning MoneyWeek team, to help you understand what really matters when it comes to your finances.

Four times a week
Look After My Bills
Sign up to our free money-saving newsletter, filled with the latest news and expert advice to help you find the best tips and deals for managing your bills. Start saving today!
These are great times to be trading the markets. One reader wrote in to say he's recently taken a cool 4,000 profit points from three trades on the Dow thanks to his Elliott wave analysis.
That's testament to what's achievable when you get the hang of this. So keep reading. You can do it, too! In MoneyWeek Trader and in my workshops and videos, I'm committed to helping you get there.
Today, let's switch back to another of my favourite markets to trade: gold. In my last chart today, I'll show you what I think marks the danger zone' for gold bulls. And on the flipside, I'll point to the resistance level that, if broken, could see higher gold prices.
MoneyWeek
Subscribe to MoneyWeek today and get your first six magazine issues absolutely FREE

Sign up to Money Morning
Don't miss the latest investment and personal finances news, market analysis, plus money-saving tips with our free twice-daily newsletter
Don't miss the latest investment and personal finances news, market analysis, plus money-saving tips with our free twice-daily newsletter
But let's see the lay of the land first.
Gold rallies to hit my major tramline
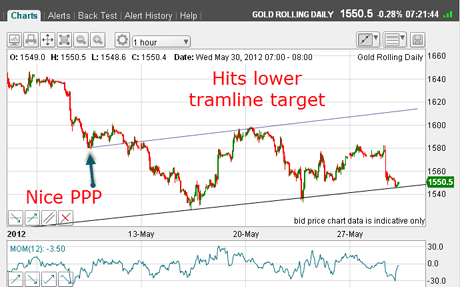
When I last covered gold on 1 June , the market had suffered a very large $140 drop from $1,670 on 1 May to a low of $1,530 on 16 May. The market then paused for breath and embarked on a counter-trend rally from a deeply oversold position.
This was the tramline position I had drawn in then:
(Click on the chart for a larger version)
In that article, although gold was following these tramlines very nicely, albeit with few touch-points, I put the odds of a rally better than those for a decline with a rally up towards the long-term tramline a distinct possibility.
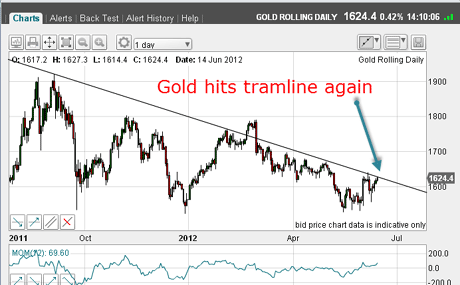
As I write this email (3pm Thursday), gold has indeed rallied right to this line:
(Click on the chart for a larger version)
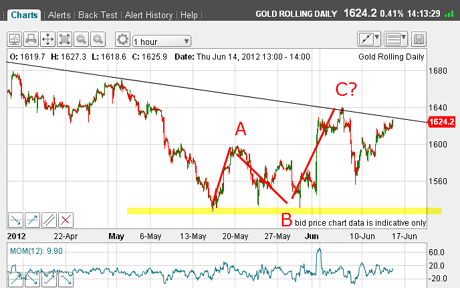
And the rally has a definite A-B-C air about, it making the rally suspect:
(Click on the chart for a larger version)
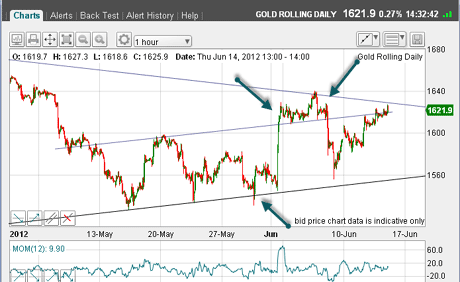
So here is the chart showing my up-sloping tramlines and the down-sloping long-term tramline:
(Click on the chart for a larger version)
There have been several head fakes' lately, as marked by my arrows. That makes my short-term tramlines less reliable than I would like.
But now, with the market knocking on the door of the main tramline, will it meet heavy resistance, or will it break upwards?
Why there could be major volatility ahead in the gold market
An upward break might indicate a major leg up or we might see another head fake spike. A turn here would spell big trouble for the bulls.
The rule with tramlines is: sell short or take profits on longs when the upper tramline is hit. So I will follow my rule.
But dark clouds hover overhead. As I look at the immediate calendar of events, I note that crucial Greek elections are set for this weekend. And next week, the Fed is likely to announce any decisions regarding further quantitative easing operations, which many are expecting.
I'm not going to hazard a guess to either outcome. But what I will say is that these events are a recipe for huge volatility and surprises. That's especially so if events turn out to be 'bullish', as bearish sentiment still runs high, for the euro particularly.
So what are the implications for the Elliott wave picture if Wednesday's $1,640 high holds and the tramline in question repels the advance?
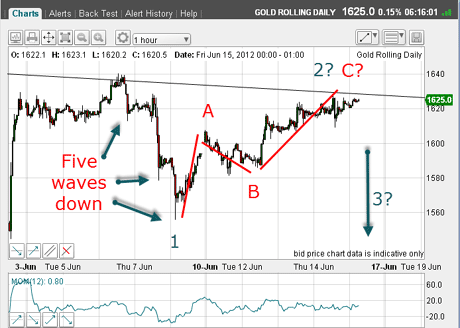
If the A-B-C completes with the C wave below the $1,640 top, then the next move will be down and, ideally, this down leg should take the form of another five-wave sequence.
Remember: fifth waves are impulse waves and travel in the direction of the larger trend.
So take a look at the next chart. Currently, I can count wave 1 down and we could be finishing off wave 2 up as I write:
(Click on the chart for a larger version)
And as I take the above screenshot this morning, I see the market dropped $15 in ten minutes yesterday, and is now recovering. This is classic behaviour at a major line of resistance.
Two critical levels I'm watching in gold
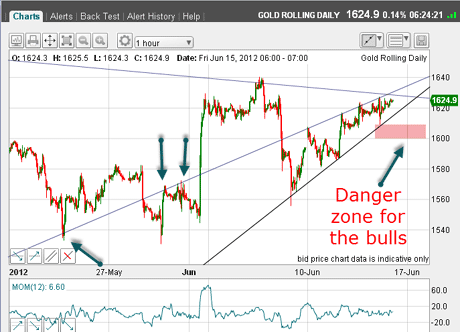
So now we are at a moment of truth. But can I see clues for action from the hourly chart? I believe I can. Take a look at this:
(Click on the chart for a larger version)
Avery pretty wedge has formed in the last few days. The upper line passes right across the recent highs very cleanly. And it also has the previous anchor points marked by the green arrows.
The lower wedge line has three good touch-points which gives me confidence that this line represents solid support. Yesterday's $15 dip stopped right at this line.
We know that upward-sloping wedges almost always resolve downwards and that is my initial forecast. But I must allow for a temporary spike up if news is 'bullish'.
Recall from when I was discussing the Dow on Wednesday, I stated that the odds were good for the Dow to make a new high above Monday's 12,750 high, and this could occur very soon. That would help gold push higher, of course.
The bottom line: If the market does move down into the danger zone, that would be a good place to enter or add to short trades.
But if the market moves above $1,640, my Elliott wave scenario would be negated and it will be back to the drawing board for me.
Are you trading or following gold? I'm always interested to get your thoughts and ideas. If you have anything to share, leave a comment below.
If you're a new reader, or need a reminder about some of the methods I refer to in my trades, then do have a look at my introductory videos:
The essentials of tramline trading
An introduction to Elliott wave theory
Advanced trading with Elliott waves
Don't miss my next trading insight. To receive all my spread betting blog posts by email, as soon as I've written them, just sign up here .
Get the latest financial news, insights and expert analysis from our award-winning MoneyWeek team, to help you understand what really matters when it comes to your finances.
John is is a British-born lapsed PhD physicist, who previously worked for Nasa on the Mars exploration team. He is a former commodity trading advisor with the US Commodities Futures Trading Commission, and worked in a boutique futures house in California in the 1980s.
He was a partner in one of the first futures newsletter advisory services, based in Washington DC, specialising in pork bellies and currencies. John is primarily a chart-reading trader, having cut his trading teeth in the days before PCs.
As well as his work in the financial world, he has launched, run and sold several 'real' businesses producing 'real' products.
-
 MoneyWeek news quiz: Can you get smart meter compensation?
Smart meter compensation rules, Premium Bonds winners, and the Bank of England’s latest base rate decision all made the news this week. How closely were you following it?
-
 Adventures in Saudi Arabia
Travel The kingdom of Saudi Arabia in the Middle East is rich in undiscovered natural beauty. Get there before everybody else does, says Merryn Somerset Webb