Gold (and miners) could be set to rocket higher
John C Burford applies his trading methods to the charts to see where the gold price could be heading next.
Get the latest financial news, insights and expert analysis from our award-winning MoneyWeek team, to help you understand what really matters when it comes to your finances.
You are now subscribed
Your newsletter sign-up was successful
Want to add more newsletters?

Twice daily
MoneyWeek
Get the latest financial news, insights and expert analysis from our award-winning MoneyWeek team, to help you understand what really matters when it comes to your finances.

Four times a week
Look After My Bills
Sign up to our free money-saving newsletter, filled with the latest news and expert advice to help you find the best tips and deals for managing your bills. Start saving today!
Last Monday, I showed that gold was very likely about to stage a sharp recovery. After analysing the waves and placing the most likely Elliott wave labels on them, I concluded that the decline off the 11 March $1,280 high was over, or nearly so.
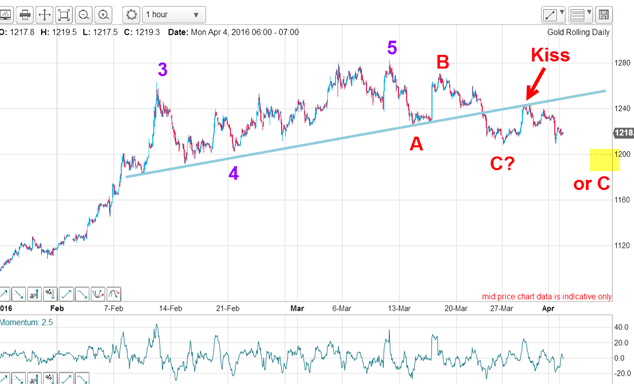
This was the hourly chart I showed then:

The $1,280 high was my purple wave 5 and the decline off it is the normal three-wave A-B-C down with the C wave in the process of finding its low. I had two options: either the C low was already in, or it would decline one more time to around the $1,190 area before staging a recovery.
MoneyWeek
Subscribe to MoneyWeek today and get your first six magazine issues absolutely FREE

Sign up to Money Morning
Don't miss the latest investment and personal finances news, market analysis, plus money-saving tips with our free twice-daily newsletter
Don't miss the latest investment and personal finances news, market analysis, plus money-saving tips with our free twice-daily newsletter
My initial target was the $1,200 area, which was the low of the purple fourth wave. This is a typical retracement level where C waves usually terminate and I was on high alert for just such an event.
In the above chart, there is some leeway in placing the purple wave 4 label because following the wave 3 high, the market made a series of slightly higher lows and any one of these is a possible wave 4 low.
And two weeks ago, the market did fall to the $1,208 level, which I considered in the ballpark of the purple wave 4 low and so I had a strong candidate for the C wave low.
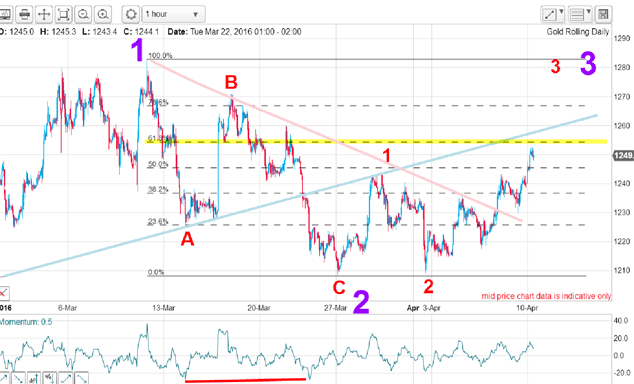
Since then, the market has rallied strongly to confirm the C wave low is indeed now in place:

That places the $1,280 high as my purple wave 1, the decline to the $1,208 low my wave 2 and now the market should be in purple wave 3 that should carry much higher before reversing.
Not only that, but the rally off the 27 March low has waves 1 and 2 (red) and now with the market having carried past the red wave 1 high at $1,245, it is in red wave 3 up.
This is highly important because if correct, we are in a third of a third which is one of the strongest wave patterns in the book. These are waves that take no prisoners, and trying to get on board is akin to catching a tiger by its tail.
But if all of this looks secure, it is not! Right up ahead lies the critical resistance of the Fibonacci 62% level. Even strong bull runs can find getting over this level a tad difficult. And sometimes, budding rallies can be nipped in the bud there.
Not only that, but the blue tramline resistance level lies a little higher. This combination should prove formidable for further gains with the potential for a traditional kiss and scalded-cat bounce back down.
Latest commitments of traders (COT) data still show a large plurality of longs to shorts among hedge funds. But interestingly, the small traders are only slightly long against short, so they are more dubious of further gains. I know I have written some harsh words against hedge funds, but they do sometimes get it right (otherwise, they would not remain in business).
Interest in gold mining shares has suddenly rocketed as have the share prices.
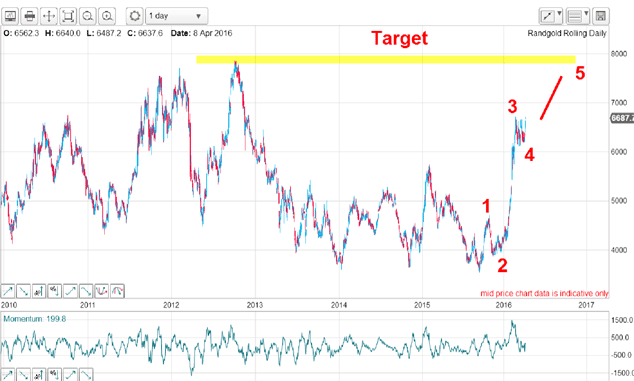
Many believe the gold recovery is temporary, but look at the stunning moves in a FTSE 100 company, Randgold:

The waves are lining up nicely with those in gold. The big difference is my wave 4 correction was minor compared with that in the gold chart. That indicates tremendous underlying strength.
This is a share well worth following as is the metal!
Get the latest financial news, insights and expert analysis from our award-winning MoneyWeek team, to help you understand what really matters when it comes to your finances.
John is is a British-born lapsed PhD physicist, who previously worked for Nasa on the Mars exploration team. He is a former commodity trading advisor with the US Commodities Futures Trading Commission, and worked in a boutique futures house in California in the 1980s.
He was a partner in one of the first futures newsletter advisory services, based in Washington DC, specialising in pork bellies and currencies. John is primarily a chart-reading trader, having cut his trading teeth in the days before PCs.
As well as his work in the financial world, he has launched, run and sold several 'real' businesses producing 'real' products.
-
 Average UK house price reaches £300,000 for first time, Halifax says
While the average house price has topped £300k, regional disparities still remain, Halifax finds.
-
 Barings Emerging Europe trust bounces back from Russia woes
Barings Emerging Europe trust has added the Middle East and Africa to its mandate, delivering a strong recovery, says Max King