Use Elliott wave theory to give your trading an edge
Every trader needs an edge over the market, says John C Burford. Applying Elliott wave theory to the charts gives you just that.
Get the latest financial news, insights and expert analysis from our award-winning MoneyWeek team, to help you understand what really matters when it comes to your finances.
You are now subscribed
Your newsletter sign-up was successful
Want to add more newsletters?

Twice daily
MoneyWeek
Get the latest financial news, insights and expert analysis from our award-winning MoneyWeek team, to help you understand what really matters when it comes to your finances.

Four times a week
Look After My Bills
Sign up to our free money-saving newsletter, filled with the latest news and expert advice to help you find the best tips and deals for managing your bills. Start saving today!
One of the major themes in my MoneyWeekTrader posts is the advantage of using basic Elliott wave theory. Every trader needs an edge that most others do not possess. If you are using a common method, then it is impossible for you to have an advantage over others. And to succeed in trading, you must be prepared to do things that most others will not do.
It is one of the many seemingly irrational aspects of trading that must be understood before you can graduate into the ranks of the serious trader.
It boils down to the way markets work. What actually moves prices? For example, in the gold market, is it the supply/demand balance of the actual metal? Or is it the manipulations of the Fed (this is one of the more colourful conspiracy theories floating around)? Or is it perhaps the news flow?
MoneyWeek
Subscribe to MoneyWeek today and get your first six magazine issues absolutely FREE

Sign up to Money Morning
Don't miss the latest investment and personal finances news, market analysis, plus money-saving tips with our free twice-daily newsletter
Don't miss the latest investment and personal finances news, market analysis, plus money-saving tips with our free twice-daily newsletter
For every market, there is one central marketplace that dominates trading. In the case of gold, it is the Comex in New York. The global price of gold is set there (and on the electronic platform in out-of-hours trading). In Comex, it is futures that are traded, not the actual metal.
So what drives the price of the futures? It is simply the ever-changing flow of buy and sell orders and the fluctuating balance of these competing forces that produce the swings up and down in the charts. And because these swings are patterned, the Elliott wave theory describes how these swings are related to each other.
This allows for forecasts to be made based on previous price action, provided the correct wave labels are applied to the current chart. That is always the challenge!
Monday's trade was right on the money

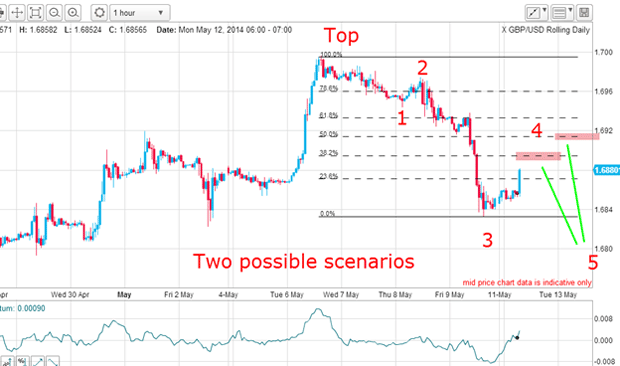
Wave 3 was instantly identified because it was 'long and strong'. On Monday morning, the market was rallying in wave 4, which I forecast would very likely terminate at either the Fibonacci 38% or 50% levels. These are the retracement levels of the wave down off the 1.70 top.
My forecast then was for the market to complete wave 4 and then head back down below the wave 3 low in wave 5. When wave 5 terminated, the market would embark on a corrective rally hopefully in an A-B-C form.
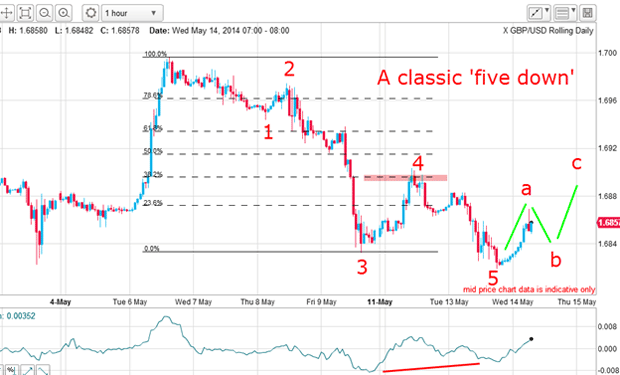
But the key point is that if this scenario panned out, the five minor waves down would be the signal that the top was in and the next big trend for GBP/USD would be down.
The power of Elliot wave analysis

Monday's rally did turn around at the Fibonacci 38% level and the market then declined below the wave 3 low. As expected, there was a strong positive-momentum divergence there signalling a weakening of the selling strength.
This morning, the market is rallying in wave a, and I expect a decline in wave b and then another rally in wave c.
In a nutshell, the scenario that I painted on Monday was right on the money. And excellent trades could have been made along the way. Isn't that pretty?
Monday's trade demonstrated the power of Elliott wave analysis, and why it would pay all traders to get to know at least the basics of this most useful method.
How to choose the correct pivot points

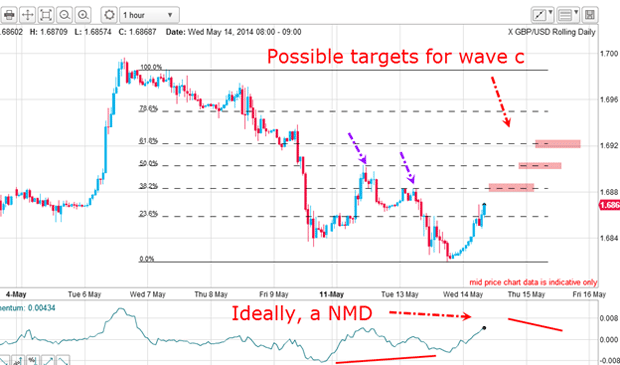
If I had chosen the absolute top as my high pivot point, then I would not get such good hits on the minor highs marked by purple arrows. These hit the precise 50% and 38% levels on the nose.
This is a way I use to check to see if I have chosen the correct pivot points.
The levels marked are the most likely turning points for wave c. If there is also a negative-momentum divergence(NMD) at the c wave high, that is my signal to start looking for a new short entry.
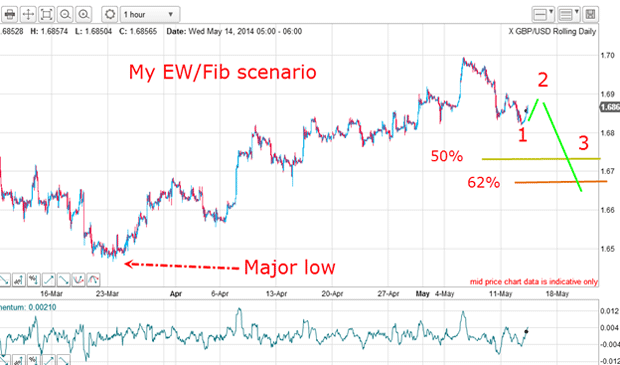
If this scenario pans out, then I expect new lows to be made. This would then be the larger Elliott wave picture:

If my five down on the hourly chart is my larger wave 1, the current rally is wave 2. My wave 3 down would then be a new low. I have marked the Fibonacci 50% and 62% levels of the big rally off the March major low, which are natural terminating points for wave 3.
This ride promises to be exciting!
Get the latest financial news, insights and expert analysis from our award-winning MoneyWeek team, to help you understand what really matters when it comes to your finances.
John is is a British-born lapsed PhD physicist, who previously worked for Nasa on the Mars exploration team. He is a former commodity trading advisor with the US Commodities Futures Trading Commission, and worked in a boutique futures house in California in the 1980s.
He was a partner in one of the first futures newsletter advisory services, based in Washington DC, specialising in pork bellies and currencies. John is primarily a chart-reading trader, having cut his trading teeth in the days before PCs.
As well as his work in the financial world, he has launched, run and sold several 'real' businesses producing 'real' products.
-
 Average UK house price reaches £300,000 for first time, Halifax says
While the average house price has topped £300k, regional disparities still remain, Halifax finds.
-
 Barings Emerging Europe trust bounces back from Russia woes
Barings Emerging Europe trust has added the Middle East and Africa to its mandate, delivering a strong recovery, says Max King