GBP tramlines have recovered in the charts
While no trading channel lasts forever, defunct ones can spring back to life. John C Burford explains what that means for the pound.
Get the latest financial news, insights and expert analysis from our award-winning MoneyWeek team, to help you understand what really matters when it comes to your finances.
You are now subscribed
Your newsletter sign-up was successful
Want to add more newsletters?

Twice daily
MoneyWeek
Get the latest financial news, insights and expert analysis from our award-winning MoneyWeek team, to help you understand what really matters when it comes to your finances.

Four times a week
Look After My Bills
Sign up to our free money-saving newsletter, filled with the latest news and expert advice to help you find the best tips and deals for managing your bills. Start saving today!
Today, I thought I would cover the GBP/USD because it is a good example of how to handle a situation where a previously good tramline fails and then recovers.
Remember that tramlines are parallel lines of support and resistance, and trading takes place in the channel between these lines.
Tramlines are used to forecast likely swing turns and enable low-risk trades to be made.
MoneyWeek
Subscribe to MoneyWeek today and get your first six magazine issues absolutely FREE

Sign up to Money Morning
Don't miss the latest investment and personal finances news, market analysis, plus money-saving tips with our free twice-daily newsletter
Don't miss the latest investment and personal finances news, market analysis, plus money-saving tips with our free twice-daily newsletter
Here is the tramline pair I had working from my 27 September post:
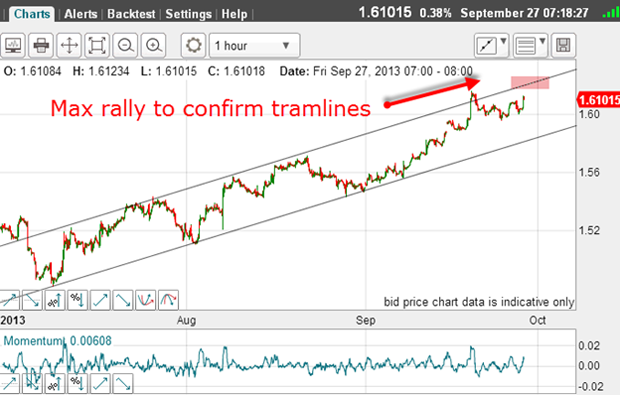
Both the lower tramline and the upper one had several excellent touch points.
This demonstrates that using the tramline trading rule - buying at, or near, the lower line and then exiting and even shorting at, or near, the upper line - was a winning strategy.
One of the great benefits of this type of tramline trading is that your trades can be done at low risk. You can place your protective stops just outside the trading channel with confidence. This means you can use my 3% rule quite readily, where your maximum loss would be 3% of your trading capital if your trade went sour.
You could, therefore, have traded in this way from the low in early July or from late August as the tramlines were forming.
For example, if you had traded long near the early September touch point and entered at a price of about 1.5550, and then exited at the high touch point in mid-September at around the 1.6100 area, that would have produced a profit of 550 pips, or £550 for each £1 spread bet.
The perfect trade
The risk to your protective stop on entry could have been in the 60 to 80-pip range, giving a reward/risk ratio of at least seven-to-one. And that is a very handsome return for the risk.
Not only that, but you would have had a firm target as you entered the trade at the upper tramline.
This was a perfect trade for these reasons: you were using a tested method (tramlines) giving you a sensible entry price. You had the direction to trade (long). You had a means to establish your stop loss, and hence the size of your bet. And finally, you had a price target to exit.
This is all we ask of a complete trading system.
How to prepare for possible declines
Did the market fall back towards the lower tramline?
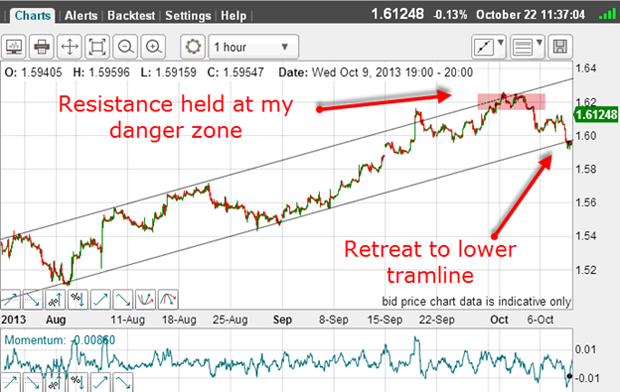
Well, not right away first, the market tested my danger zone (pink bar), and then fell back to the lower tramline.
As the market was testing this zone, was there any way to prepare for a possible decline? After all, using my tramline method, that would be the correct trade.
At times like this, I like to zoom in a little closer:
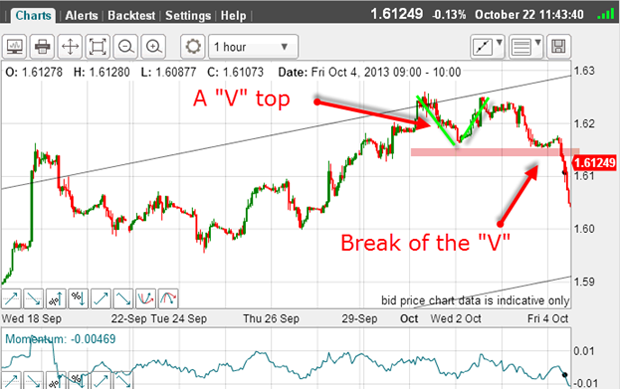
The market had rallied to the upper tramline and had made a characteristic 'V' pattern.
I find that if this marks the top of the move, a break of the 'V' confirms that the trend has changed to down. Therefore, placing an entry sell-stop just below it often gives a secure entry.
Sure enough, the market moved lower off the 'V' and hit the lower tramline:
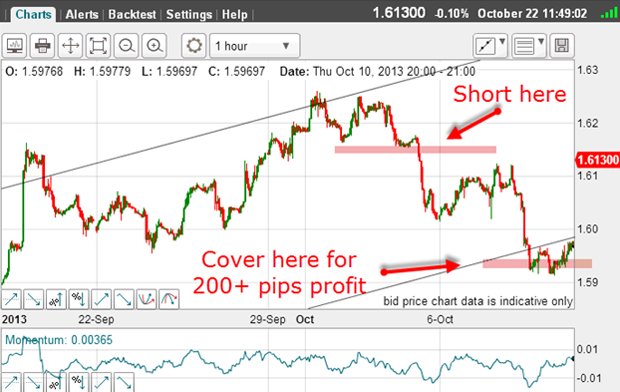
And there was a potential 200 pips profit available on this trade.
In other words, for the two trades there would have been a total of 750 pips profit. And this is the result of taking a disciplined approach - the basic tramline method.
Broken tramlines and false signals
Does that mean my previously helpful tramlines are no longer valid?
It is a sad fact that tramlines do not remain valid forever. Eventually, they give false signals. And I'm afraid there is no warning signal that tells us when this is about to occur.
But as you can see, the market is reluctant to separate from the lower tramline it likes kissing it!
Naturally, I could trade short on the kisses, and that would be a valid trade.
Let's see how this would have played out:
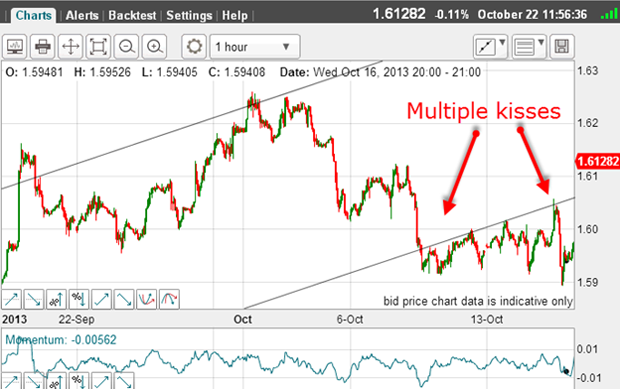
How romantic! Look at all those kisses but my short trade is looking problematic. The volatility has really picked up: within a few hours there are 150-pip swings.
What can't go down must go up
But each kiss is made right on the underside of the lower tramline. It is still a valid tramline, so far.
But the increased volatility is a signal that all is not well with the bearish interpretation and this is how the market is playing out as I write:
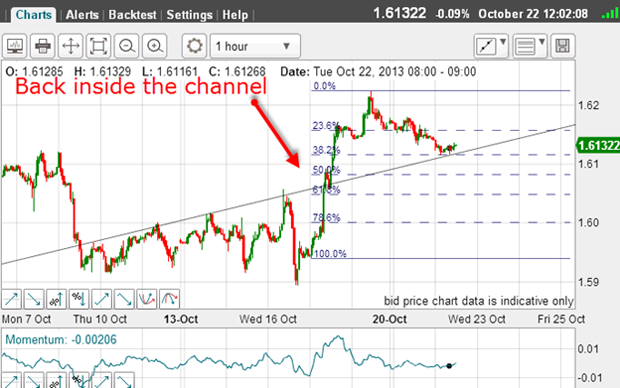
In the markets, we have an expression: What can't go down must go up.
And up it went, breaking back into the trading channel, wiping out my short trade (but was protected by a 3% stop, of course).
Now the market is currently resting back on the tramline, at the Fibonacci 38% retrace level.
Will the tramline hold as support still? This is a big test.
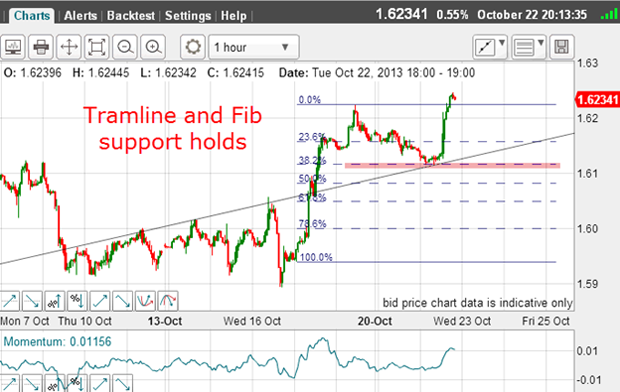
All we can do is keep the faith. During the recent trading outside the channel, the kisses still precisely respected the lower tramline. It acted as a line of resistance.
Therefore, the odds are that the support will hold. And if it does so, we can expect another leg up.
Latest update: This support did hold and the market reacted positively to the US jobs report:
The best way to trade a 'head fake'
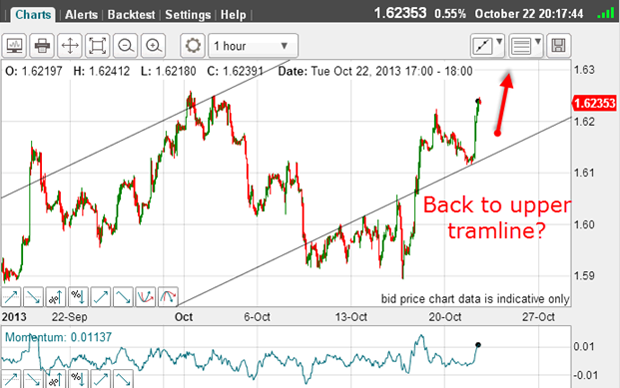
This lies in the 1.65 1.66 area at present, which is about 300 pips plus from the current market.
As it turns out, my original tramlines are still working. I can now call the period of trading under the lower tramline a head fake.
Head fakes are nasty, but the fact that the market rallied back inside the trading channel was a clear sign that it wanted to move up. The line in the sand for the short trade was the lower tramline. Therefore, my protective stop on my short trade could be placed just above the line.
But having been stopped out of the short, I had a clear signal to reverse and go long.
That is the best way to trade the head fake.
Get the latest financial news, insights and expert analysis from our award-winning MoneyWeek team, to help you understand what really matters when it comes to your finances.
John is is a British-born lapsed PhD physicist, who previously worked for Nasa on the Mars exploration team. He is a former commodity trading advisor with the US Commodities Futures Trading Commission, and worked in a boutique futures house in California in the 1980s.
He was a partner in one of the first futures newsletter advisory services, based in Washington DC, specialising in pork bellies and currencies. John is primarily a chart-reading trader, having cut his trading teeth in the days before PCs.
As well as his work in the financial world, he has launched, run and sold several 'real' businesses producing 'real' products.
-
 Average UK house price reaches £300,000 for first time, Halifax says
While the average house price has topped £300k, regional disparities still remain, Halifax finds.
-
 Barings Emerging Europe trust bounces back from Russia woes
Barings Emerging Europe trust has added the Middle East and Africa to its mandate, delivering a strong recovery, says Max King