Fine-tuning trades with Fibonacci retracements
Tramline trading is a useful way to identify entry and exit points to a trade. But it is not a precise science. To really home in on targets, you need to employ Fibonacci theory. John C Burford explains how with an example from the Dow's recent rally.
Get the latest financial news, insights and expert analysis from our award-winning MoneyWeek team, to help you understand what really matters when it comes to your finances.
You are now subscribed
Your newsletter sign-up was successful
Want to add more newsletters?

Twice daily
MoneyWeek
Get the latest financial news, insights and expert analysis from our award-winning MoneyWeek team, to help you understand what really matters when it comes to your finances.

Four times a week
Look After My Bills
Sign up to our free money-saving newsletter, filled with the latest news and expert advice to help you find the best tips and deals for managing your bills. Start saving today!
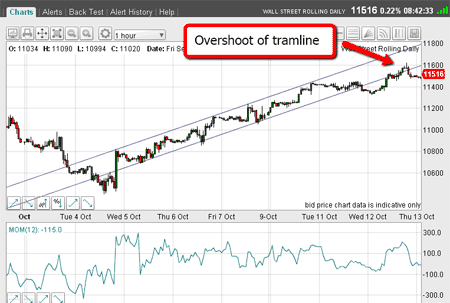
Yesterday, I pointed to a strong upside target at the underside of my tramline. In afternoon trading, this target was hit and then the market backed off towards the close.

(Click on the chart for a larger version)
In fact, we saw an overshoot of the 'perfect' tramline kiss. But that was not unexpected, since this current rally is very powerful and overshoots are likely.
MoneyWeek
Subscribe to MoneyWeek today and get your first six magazine issues absolutely FREE

Sign up to Money Morning
Don't miss the latest investment and personal finances news, market analysis, plus money-saving tips with our free twice-daily newsletter
Don't miss the latest investment and personal finances news, market analysis, plus money-saving tips with our free twice-daily newsletter
Measuring the final target when tramlines are steep is not a precise science, unfortunately.
But I have one other tool in my bag that can pinpoint a more accurate target!
That is the Fibonacci retracement levels. I have not been able to incorporate Fibonacci into my analysis for some time, but with the rally getting very extended, this is the perfect time to lay Fibonacci levels on the chart.
If you have not seen how I use Fibonacci theory, watch my video tutorial: Trading with Fibonacci levels.
Let's look at the longer-term picture on the daily chart:

(Click on the chart for a larger version)
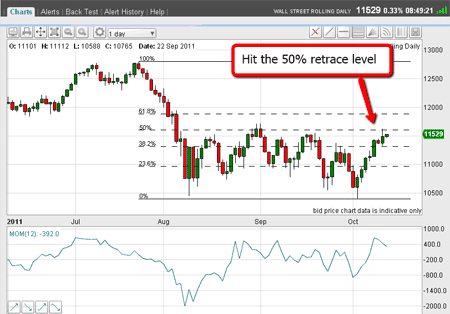
I have drawn the Fibonacci levels using the 22 July high and the 4 October low. These are the most recent significant pivot points.
The 50% level, at around 11,600, was hit on the dot. That was the ideal place to enter short trades, with the benefit that a tight protective stop could be employed.
Trading tip: Many traders find it difficult shorting into a strong rally. But when you have a precise target, as we have here, it is actually one of the safest types of trades to make! That is because if you are wrong, and the resistance does not hold, you will know very soon, and a tight stop will give this game away.
Keeping losses small is one of the key factors in trading success.
Note that in early September, the 50% level also turned the market back down. There is evidently significant resistance at this level.
But although the market is severely overbought, and the significant resistance at 50% retrace has been hit, there is the possibility that another upward surge could take the market above yesterday's high.
That would really cause me to scratch my head as to the next target.
The next Fibonacci level is around 11,900 another 350 pips up. That move would take out all the major buy stops placed above the August-September highs I have mentioned previously.
However, at this point, I believe the odds favour at least a modest pull-back before another moment of truth.
That moment of truth is: will the market continue on its big bear decline which started in May, or will it stage a third (C) wave rally that I have pencilled in?
The nature of the pull-back over the next few days should give me some clues which path is the more likely.
I hope to cover gold tomorrow, as there are some exciting developments taking place.
If you're a new reader, or need a reminder about some of the methods I refer to in my trades, then do have a look at my introductory videos:
The essentials of tramline trading
An introduction to Elliott wave theory
Don't miss my next trading insight. To receive all my spread betting blog posts by email, as soon as I've written them, just sign up here .
Get the latest financial news, insights and expert analysis from our award-winning MoneyWeek team, to help you understand what really matters when it comes to your finances.
John is is a British-born lapsed PhD physicist, who previously worked for Nasa on the Mars exploration team. He is a former commodity trading advisor with the US Commodities Futures Trading Commission, and worked in a boutique futures house in California in the 1980s.
He was a partner in one of the first futures newsletter advisory services, based in Washington DC, specialising in pork bellies and currencies. John is primarily a chart-reading trader, having cut his trading teeth in the days before PCs.
As well as his work in the financial world, he has launched, run and sold several 'real' businesses producing 'real' products.
-
 Average UK house price reaches £300,000 for first time, Halifax says
While the average house price has topped £300k, regional disparities still remain, Halifax finds.
-
 Barings Emerging Europe trust bounces back from Russia woes
Barings Emerging Europe trust has added the Middle East and Africa to its mandate, delivering a strong recovery, says Max King