Finding support and resistance levels in the currency markets
John C Burford looks at why support and resistance levels work so well in the markets, and how spread betters can use Fibonacci theory to find them.
Get the latest financial news, insights and expert analysis from our award-winning MoneyWeek team, to help you understand what really matters when it comes to your finances.
You are now subscribed
Your newsletter sign-up was successful
Want to add more newsletters?

Twice daily
MoneyWeek
Get the latest financial news, insights and expert analysis from our award-winning MoneyWeek team, to help you understand what really matters when it comes to your finances.

Four times a week
Look After My Bills
Sign up to our free money-saving newsletter, filled with the latest news and expert advice to help you find the best tips and deals for managing your bills. Start saving today!
When I last left the dollar, it was in the process of forming a low: 2011 could be a historic year for the US dollar. At least, with the market testing the Fibonacci 76.4% retracement of the May droop, that's the way it appeared to me.
But let's switch over to the euro, since the EUR/USD is a lot easier to trade than the dollar index!
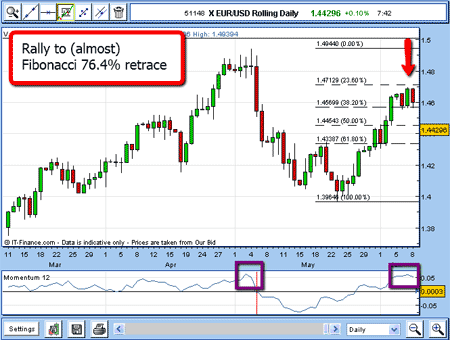
Here is the May action up to the time of my previous post:
MoneyWeek
Subscribe to MoneyWeek today and get your first six magazine issues absolutely FREE

Sign up to Money Morning
Don't miss the latest investment and personal finances news, market analysis, plus money-saving tips with our free twice-daily newsletter
Don't miss the latest investment and personal finances news, market analysis, plus money-saving tips with our free twice-daily newsletter

(Click on the chart for a larger version)
The rally off the early May low has carried to just shy of the Fibonacci 76.4% retracement and on overbought momentum (purple box).
Will this be the high for the rally?
The last time the momentum reading was this one-sided, the market took a tumble after May 4 of around 900 pips in ten days. Maybe history will repeat?
So if the market has topped, where shall we set our short-term target?
If short-term trading, we need to have a firm grip on our projected targets, since we must maximise our profits. After all, we are often looking for relatively small price differentials.
This is best done by taking profits when prices spike in our direction, and preferably, when momentum readings become lop-sided.
One of the most reliable (and oldest) methods for discovering price support or resistance levels is simply to examine the chart for previous recent significant highs (in the case of a bear move, as we have here).
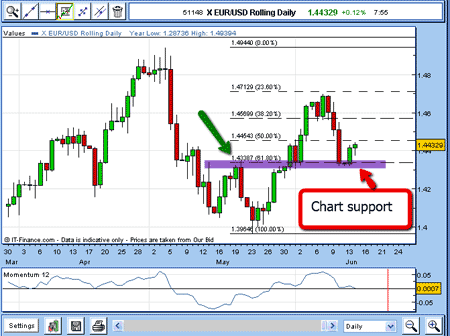
Here is the daily chart updated to this morning (Tuesday June 14):

(Click on the chart for a larger version)
The market has fallen back from the Fibonacci 76.4% retrace high, as I surmised.
A short position could have been taken anywhere above the 1.4650 area.
And it has fallen sharply down to the area marked by my purple bar, which is the level of the previous high at 1.4330 made in early May (marked with green arrow).
That 19 May high is a significant one, since its upward break in early June propelled the market another 350+ pips higher in a few days. There are bound to be many buyers at around that level.
And so, as of this morning, the market is bouncing off this support, which validates my chart support theory. Short-term traders could take profits there for a tidy 300+ pip profit in three or four days.
The question now is: How high will the current rally carry?
As ever, I will apply my Fibonacci tool to the 1.47 high and the recent 1.43 low and start from there. I will also look out for any tramlines that are forming.
Why dosupport and resistance levels work so well?
Now, why do these chart support (and resistance) levels work as well as they do?
The classic reasoning is that those who have shorted near the 19 May high will be under water in the late May early June rally. When they saw the market drop back down to near their entry, they gladly took the opportunity to cover their positions with a much reduced loss and breathe a sigh of relief.
I'm sure there is some truth to this, but we must always bear in mind that the market is made up of a whole host of participants who have varying reasons for their buy or sell actions.
It always amuses me to read (especially in the mainstream press) that when a market stages a big rally, they ascribe this to "investors being encouraged by the recent economic data", or some such nonsense.
They never mention the sellers who sold to the buyers and their motivations.
I would love to see a report that says "The market rallied because the bears took advantage of the higher prices offered by the bulls".
But that wouldn't sell newspapers, I guess.
I will follow this market as I believe it will continue to offer great examples of basic trading principles that any trader can use to advantage.
NB: Don't miss my next trading insight. To receive all my spread betting blog posts by email, as soon as I've written them, just sign up here .
Get the latest financial news, insights and expert analysis from our award-winning MoneyWeek team, to help you understand what really matters when it comes to your finances.
John is is a British-born lapsed PhD physicist, who previously worked for Nasa on the Mars exploration team. He is a former commodity trading advisor with the US Commodities Futures Trading Commission, and worked in a boutique futures house in California in the 1980s.
He was a partner in one of the first futures newsletter advisory services, based in Washington DC, specialising in pork bellies and currencies. John is primarily a chart-reading trader, having cut his trading teeth in the days before PCs.
As well as his work in the financial world, he has launched, run and sold several 'real' businesses producing 'real' products.
-
 MoneyWeek Talks: The funds to choose in 2026
Podcast Fidelity's Tom Stevenson reveals his top three funds for 2026 for your ISA or self-invested personal pension
-
 Three companies with deep economic moats to buy now
Opinion An economic moat can underpin a company's future returns. Here, Imran Sattar, portfolio manager at Edinburgh Investment Trust, selects three stocks to buy now