The danger of setting your stops too close
Following a decline in the gold market, John C Burford moves his protective stop down only to see his trade stopped out as a result of a vicious spike in the gold price. Yet, his forecast of a downtrend holds true and another opportunity for a short sale presents itself.
Get the latest financial news, insights and expert analysis from our award-winning MoneyWeek team, to help you understand what really matters when it comes to your finances.
You are now subscribed
Your newsletter sign-up was successful
Want to add more newsletters?

Twice daily
MoneyWeek
Get the latest financial news, insights and expert analysis from our award-winning MoneyWeek team, to help you understand what really matters when it comes to your finances.

Four times a week
Look After My Bills
Sign up to our free money-saving newsletter, filled with the latest news and expert advice to help you find the best tips and deals for managing your bills. Start saving today!
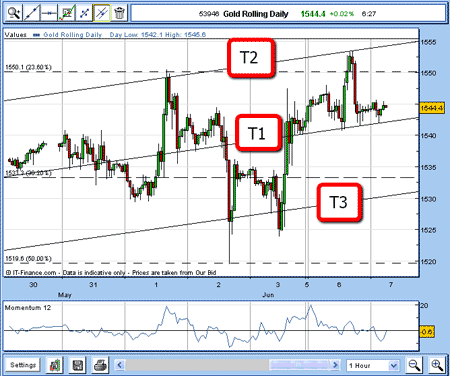
Last week,I wrote about some gold trades: Four key traders lessons that will keep you in the game. I left it with the market trading above my central tramline T1:

(Click on the chart for a larger version)
I then stated that I would be setting a sell-stop to enter a short trade just below T1. I also said that I would be setting a protective buy-stop of around $5 on this trade.
MoneyWeek
Subscribe to MoneyWeek today and get your first six magazine issues absolutely FREE

Sign up to Money Morning
Don't miss the latest investment and personal finances news, market analysis, plus money-saving tips with our free twice-daily newsletter
Don't miss the latest investment and personal finances news, market analysis, plus money-saving tips with our free twice-daily newsletter
I suggested that if T1 were to give way, my first target would be the lowest tramline, T3.
So let's see how this action developed.
What happened next?
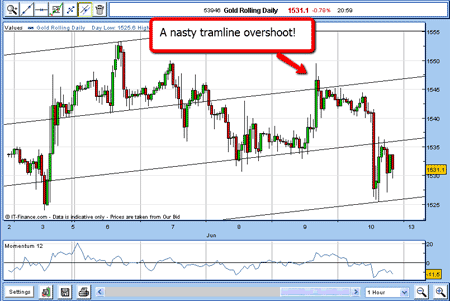
Right after this, gold did indeed drop down and broke beneath T1 and I was stopped in at the $1,542 level. I then placed my stop at $1,547. The $5 risk was well within my 3% Rule.

(Click on the chart for a larger version)
As you can see, the market did fall to T3 at the $1,534 area on June 9.
Very short-term traders would be offered the chance to take profits there of around £80 per £1 spread bet.
But I decided to move my stop down to break-even following my Break-Even Rule. There was a paper gain of $8 and I wanted to give this trade room to work lower, if the market wished to cooperate.
Stopped out on a vicious spike
But as you can see, in the afternoon of Thursday June 9, the market rallied through my stop, taking me out for a break-even trade (a "wash"). And it carried right on to spike above T1.
These spiky overshoots are common in gold, which makes gold trading very tricky in the short-term.
The market then reversed course and is currently heading lower as I originally forecast!
In fact, the market has fallen to my even lower Tramline at the $1,526 level. This is annoying, as I believe gold has the potential to move very much lower and I don't want to miss this trade.
So, how should I approach this market?
It is clear that setting very close stops is generally a poor idea unless you get lucky.
For me, it is far better to first focus on the larger trends (if any) on the daily chart, and then go to the hourly chart.
Here is the current situation:

(Click on the chart for a larger version)
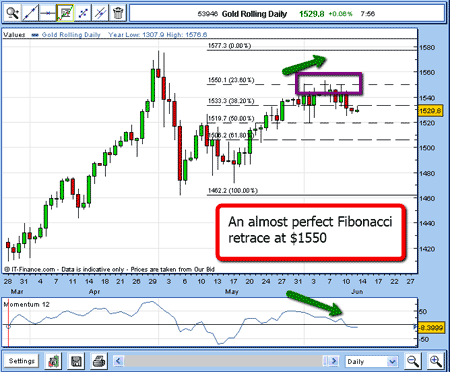
If I believe the May 1 high at $1,577 will stand for some time and I have good reasons for this view then the current rally is a retracement of the sharp May fall.
That means the rally will likely stop at a Fibonacci retracement. And so it has (so far!).
Note the weakening momentum (marked by green arrows) as the $1,550 level was approached a bearish sign.
Getting back to the question of how to trade gold here, the current market is only about $20 off the retracement rally high.
So a trader who is able to set a wider protective stop could short anywhere here and set the stop just above the $1,550 level.
If the market rallied back to this area, it would likely negate my retracement idea.
And this style of trading would get around the annoying habit of gold to make spiky moves which stop us out prematurely.
As ever, it is very much a personal decision which trading style to adopt. There is no "best" way to trade for everyone. As a trader, you must work on your own style and develop it.
The good news is that, as with most things, the more trades you do, the more efficient you become. And having some background knowledge such as this can help you make an informed decision.
Also, the more you study the charts and observe the action around Fibonacci retracements and the tramlines, the more in tune' with the markets you become making you a better trader.
NB: Don't miss my next trading insight. To receive all my spread betting blog posts by email, as soon as I've written them, just sign up here .
Get the latest financial news, insights and expert analysis from our award-winning MoneyWeek team, to help you understand what really matters when it comes to your finances.
John is is a British-born lapsed PhD physicist, who previously worked for Nasa on the Mars exploration team. He is a former commodity trading advisor with the US Commodities Futures Trading Commission, and worked in a boutique futures house in California in the 1980s.
He was a partner in one of the first futures newsletter advisory services, based in Washington DC, specialising in pork bellies and currencies. John is primarily a chart-reading trader, having cut his trading teeth in the days before PCs.
As well as his work in the financial world, he has launched, run and sold several 'real' businesses producing 'real' products.
-
 MoneyWeek Talks: The funds to choose in 2026
Podcast Fidelity's Tom Stevenson reveals his top three funds for 2026 for your ISA or self-invested personal pension
-
 Three companies with deep economic moats to buy now
Opinion An economic moat can underpin a company's future returns. Here, Imran Sattar, portfolio manager at Edinburgh Investment Trust, selects three stocks to buy now