2011 could be a historic year for the US dollar
Everybody hates the US dollar - 95% of investors are bearish on it. But John C Burford isn't so sure. A pattern in the charts could indicate a major reversal for the greenback.
Get the latest financial news, insights and expert analysis from our award-winning MoneyWeek team, to help you understand what really matters when it comes to your finances.
You are now subscribed
Your newsletter sign-up was successful
Want to add more newsletters?

Twice daily
MoneyWeek
Get the latest financial news, insights and expert analysis from our award-winning MoneyWeek team, to help you understand what really matters when it comes to your finances.

Four times a week
Look After My Bills
Sign up to our free money-saving newsletter, filled with the latest news and expert advice to help you find the best tips and deals for managing your bills. Start saving today!
I haven't covered the US dollar for some time. Now looks a good time to do so, as I have spotted a chart pattern that normally indicates a trend reversal.
If I am correct, this could be a major turning point for all markets. The US dollar holds the key to just about every asset market out there.
We have seen huge bull markets in gold, silver, copper, crude oil, grains, stocks even bonds have been at the party.
MoneyWeek
Subscribe to MoneyWeek today and get your first six magazine issues absolutely FREE

Sign up to Money Morning
Don't miss the latest investment and personal finances news, market analysis, plus money-saving tips with our free twice-daily newsletter
Don't miss the latest investment and personal finances news, market analysis, plus money-saving tips with our free twice-daily newsletter
And the story is mainly about the value of the dollar.
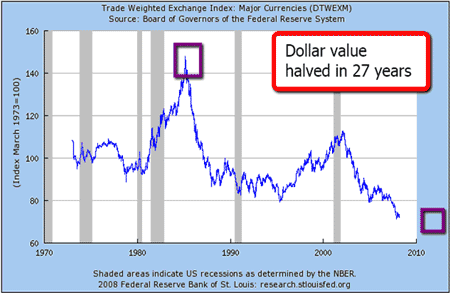
Here is a long-range chart going back to the fixed-rate Bretton Woods period:

(Click on the chart for a larger version)
Buy low, sell high the dollar fits the bill
The purple box to the right shows where the dollar is valued today. On the golden rule of investing: 'buy low and sell high', I am looking to go long the dollar.
Incidentally, very few agree with me, for the various measures of sentiment towards the dollar have been running at around 5% dollar bullish for some time.
Obviously, 95% of investors in the dollar have either never heard of the sensible Golden Rule, or they are letting their emotions rule their trading a topic I'll be discussing in detail at the MoneyWeek conference next Friday.
So let's see if I can spot a dollar low.
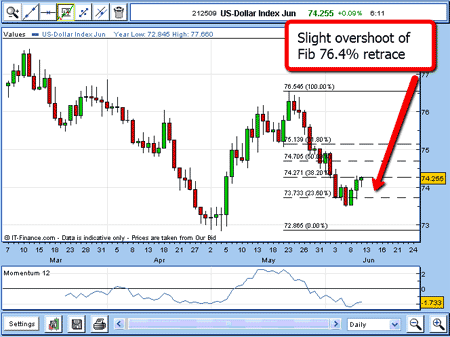
Here is the daily chart going back three months:

(Click on the chart for a larger version)
After a persistent bear market, the dollar made a low in early May, has staged a sharp rally, and is falling back to test the May low.
As usual, I have drawn the Fibonacci retracements of the May rally. If the market is forming a bottom, it usually bounces off one of the Fibonacci retracements.
Just this week, the market has slightly penetrated the 76.4% retrace, and is moving up again.
Three signs that the US dollar trend is turning
Normally, I consider this action perfectly normal in an ongoing bear market, but there is strong evidence that a change of trend is in the making and here it is:

(Click on the chart for a larger version)
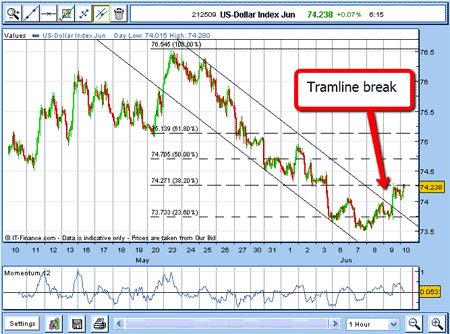
I have drawn a pair of tramlines enclosing trading down from the May high and we have an upward break through the upper tramline. That is the first clue.
At this point, I like to zero in on the finer scale to look for more clues. Here is the hourly chart:

(Click on the chart for a larger version)
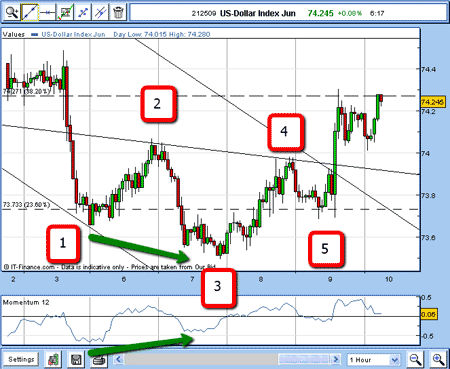
The significant pattern here is the 1-2-3-4-5 count at the bottom of the pull-back. I have found over the years that a clear five-wave pattern at the end of a strong move very often signals a change of trend and this one is a beauty.
We have an upward break of the trendline drawn across waves 2 and 4, which validates the pattern.
The third clue is the positive momentum divergencebetween waves 1 and 3. This indicates the selling pressure was getting weaker as the new lows were being made or conversely, the buying pressure was getting stronger.
This is very often another signal that a change of trend is in the works.
So, with all the above evidence, I feel the odds are getting much stronger that the dollar is reversing from down to up. That is what the charts are telling me.
And the beauty of trading on the charts like this is that we know what would need to happen if our analysis is wrong. If the dollar plunges way below my wave 2-4 trendline, that would indicate a failure.
But so long as the market can keep its head above that watermark, the budding rally is intact.
And because the dollar is at a critical juncture, I shall continue with this story sometimes focusing on the EUR/USD and GBP/USD markets.
Another currency cross with great potential is USD/JY, which has also been in a big bear market, but is showing signs of life.
I have a feeling that 2011 will see great explosions and implosions in the markets, and should turn out to be a historic year.
NB: Don't miss my next trading insight. To receive all my spread betting blog posts by email, as soon as I've written them, just sign up here .
Get the latest financial news, insights and expert analysis from our award-winning MoneyWeek team, to help you understand what really matters when it comes to your finances.
John is is a British-born lapsed PhD physicist, who previously worked for Nasa on the Mars exploration team. He is a former commodity trading advisor with the US Commodities Futures Trading Commission, and worked in a boutique futures house in California in the 1980s.
He was a partner in one of the first futures newsletter advisory services, based in Washington DC, specialising in pork bellies and currencies. John is primarily a chart-reading trader, having cut his trading teeth in the days before PCs.
As well as his work in the financial world, he has launched, run and sold several 'real' businesses producing 'real' products.
-
 Average UK house price reaches £300,000 for first time, Halifax says
While the average house price has topped £300k, regional disparities still remain, Halifax finds.
-
 Barings Emerging Europe trust bounces back from Russia woes
Barings Emerging Europe trust has added the Middle East and Africa to its mandate, delivering a strong recovery, says Max King