Elliot waves within Elliot waves in the charts
Careful analysis of Elliot waves in the charts can give you a good indication of where the market is heading. John C Burford looks at the pound / dollar market to explain how.
Get the latest financial news, insights and expert analysis from our award-winning MoneyWeek team, to help you understand what really matters when it comes to your finances.
You are now subscribed
Your newsletter sign-up was successful
Want to add more newsletters?

Twice daily
MoneyWeek
Get the latest financial news, insights and expert analysis from our award-winning MoneyWeek team, to help you understand what really matters when it comes to your finances.

Four times a week
Look After My Bills
Sign up to our free money-saving newsletter, filled with the latest news and expert advice to help you find the best tips and deals for managing your bills. Start saving today!
The big picture' is the first thing I look at when studying a market. That is because markets have memories and future price movements are heavily influenced by the past.
Why is this? Surely, markets possess no emotions, are merely the expression of the mechanical buying and selling decisions of thousands of participants?
Whenever a price is recorded, it means that the latest buyer and seller have agreed a price to transact business.
MoneyWeek
Subscribe to MoneyWeek today and get your first six magazine issues absolutely FREE

Sign up to Money Morning
Don't miss the latest investment and personal finances news, market analysis, plus money-saving tips with our free twice-daily newsletter
Don't miss the latest investment and personal finances news, market analysis, plus money-saving tips with our free twice-daily newsletter
Then, with this knowledge, the next buyer and seller do business and there is a new price. If the buyer is more insistent, the price will likely be higher than before, and vice versa.
If you believe that the price level is random, ask yourself this: If you wish to, say, go long the GBP/USD, would you do it without knowledge of the price of the last trade? Not many would.
Most traders would consider whether the market has been falling or rising, and from what level, before they consider trading.
And markets do have memories. This is amply demonstrated by the trendlines that join significant highs or lows, sometimes over extended periods.
So let's look at the daily GBP/USD chart (commonly called cable) going back a few years:
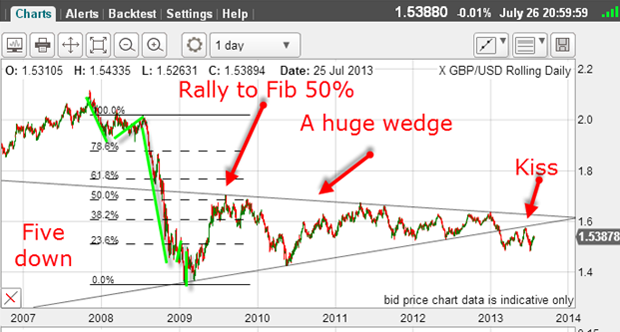
Following the 2008 collapse, when many feared the demise of fiat currencies, the market stabilised.
The move down was a clear five-wave affair (green bars) and the subsequent rally was a precise Fibonacci 50% retrace. This is textbook Elliot wave action.
And earlier this year the market broke below the lower wedge line, kissed this line, and has backed off in a scalded cat bounce down. Again, right out of the textbook.
There were some big swings within that wedge, so let's examine some with Elliott wave analysis.
Here is the late 2009 decline off the Fibonacci 50% retrace:
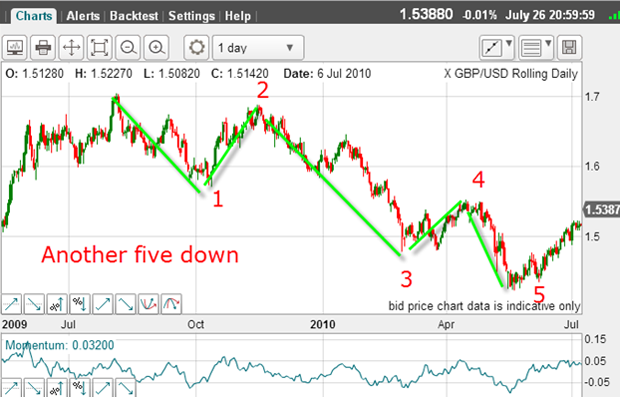
This year's trading is also a classic five waves down. When I see this, I always look at wave 3 and look for five sub-waves within. This adds validity to my count.
Here is that third wave:
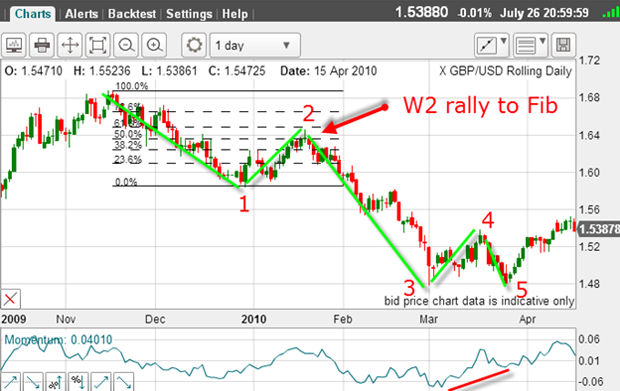
There is also a clear five-wave pattern, where wave 2 rallies to the Fibonacci 50% retrace level and wave 3 is long and strong.
And there is a huge positive-momentum divergence at wave 5 (red bar). Although this does not occur on all fifth waves, these divergences are very common.
Repeating Elliot waves
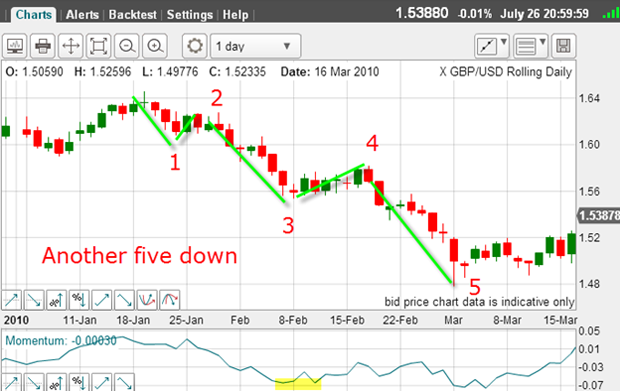
My wave 3 label qualifies, since momentum is weak at the low (yellow highlight). Now this analysis gives me high confidence that my labels are correct.
So, after the five down in the first chart, what should we expect? Yes, three waves up (or similar), and this is precisely what we got:
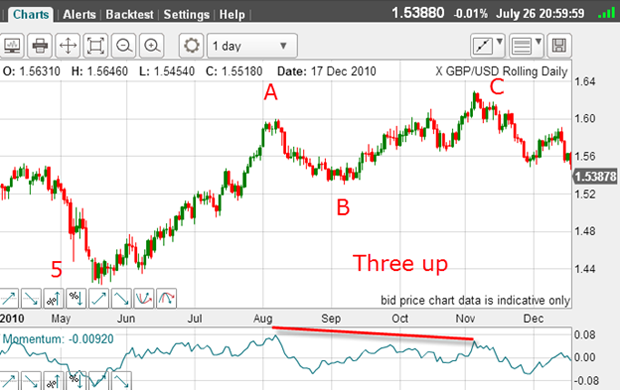
And a whopping negative-momentum divergence at the C wave high. These charts really need to go into the textbook!
Now, by correctly guessing where the Elliott wave labels fit, we have a road map for the future price action. Would you like to know with high confidence where the market will go next? That is what basic Elliott wave analysis can offer you.
OK, with this large pattern of five down and three up, we know that the most likely larger move is down.
Elliott wave rule: When you can count five down and then three up, the five down is normally in the same direction of the larger trend in this case, down.
So traders should expect that when the C wave finishes, the next big move will be down.
But did it fall?
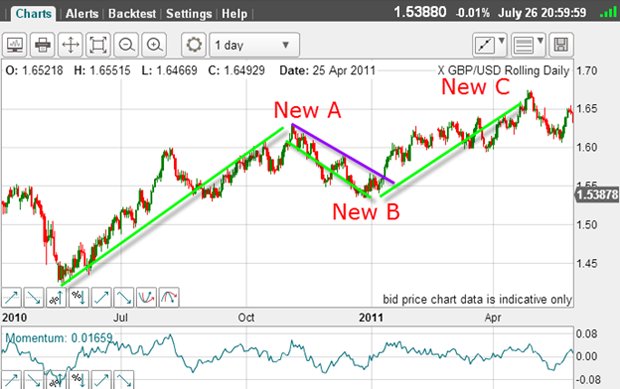
Yes, at first it did, but after an A-B-C move down it rallied again above the purple tramline and went on to make a new high.
So was my three up theory wrong? No I just had to place the labels on different points, as marked. In real time, this is often necessary.
Now why did I believe the high marked as the C wave was likely to be the top?
Simply because I measured the height of the A wave and the C wave and found that they held a common relationship the C wave was a Fibonacci 62% of the A wave.
That was a clue that I had found the top of the bear market rally.
And since then the market has swung wildly, with no clear direction. But the large scale picture still holds we are in a bear market rally, the wedge has been broken and the market is backing off from the kiss of the lower wedge line.
Let's start from the 2013 high:
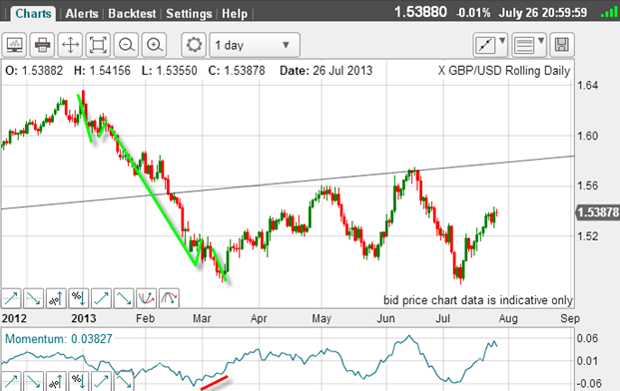
I have a clear five down to the March low complete with a hefty positive-momentum divergence at the wave 5 low. The rally has carried to the underside of the wedge line and has been rebuffed.
A wild ride
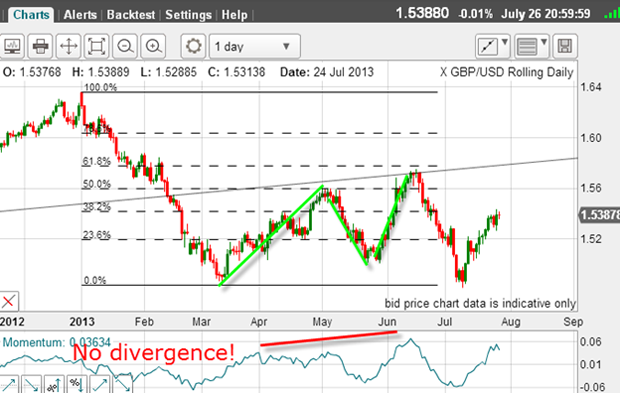
There was a nice A-B-C without a momentum divergence. This may be significant later. Then, the market fell back to make a double bottom in the 1.48 area and is currently in rally mode.
Remember, I have another five down from January and three up and so I expect a continuation of the downtrend. Let's examine the decline off the kiss to see where we are today:
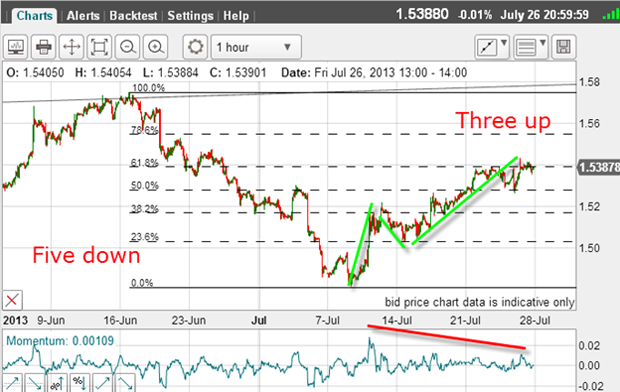
Once again, there is that five down pattern, and now we have a budding three up.
There have been so many five down, three ups that the picture is pretty clear. The market remains in a downtrend and I should trade from the short side.
The C wave rally has carried to the Fibonacci 62% retrace on a huge negative-momentum divergence. This point looks like a great place to enter short trades.
If I am correct, what can I expect?

If these labels are correct, we are in wave 3 of the large trend (green) and in wave 2 of the smaller trend (purple). When the market turns, I believe there will be very rapid progress to the downside as third of a third' waves give the most powerful moves.
The point about third waves is to be in them early and then hang on for what often turns out to be a wild ride!
Get the latest financial news, insights and expert analysis from our award-winning MoneyWeek team, to help you understand what really matters when it comes to your finances.
John is is a British-born lapsed PhD physicist, who previously worked for Nasa on the Mars exploration team. He is a former commodity trading advisor with the US Commodities Futures Trading Commission, and worked in a boutique futures house in California in the 1980s.
He was a partner in one of the first futures newsletter advisory services, based in Washington DC, specialising in pork bellies and currencies. John is primarily a chart-reading trader, having cut his trading teeth in the days before PCs.
As well as his work in the financial world, he has launched, run and sold several 'real' businesses producing 'real' products.
-
 Average UK house price reaches £300,000 for first time, Halifax says
While the average house price has topped £300k, regional disparities still remain, Halifax finds.
-
 Barings Emerging Europe trust bounces back from Russia woes
Barings Emerging Europe trust has added the Middle East and Africa to its mandate, delivering a strong recovery, says Max King