Well, this morning I'm greeted by a sea of red on my trading screens. And that makes it difficult to choose which market to cover.
Remember, MoneyWeek Trader aims to do two things. For one, I'm trying to help you understand how markets work a basic concept that eludes the vast majority of observers.
But more importantly, I'm showing you, with real examples, how I use my own trading methods with the aim of extracting profits with low risk.
Try 6 free issues of MoneyWeek today
Get unparalleled financial insight, analysis and expert opinion you can profit from.

Sign up to Money Morning
Don't miss the latest investment and personal finances news, market analysis, plus money-saving tips with our free twice-daily newsletter
Don't miss the latest investment and personal finances news, market analysis, plus money-saving tips with our free twice-daily newsletter
If you follow MoneyWeek Trader, I hope to help improve your trading and set you on the path to consistent, low-risk trading profits.

Let's see what's been going on
The Dow follows the script and falls
On Wednesday , I covered the Dow and said that the market had two clear options. One was for a post-Fed rally to the Fibonacci 76% retrace at the 13,000 area. The other was for the rally top to be in and then to look for a sharp decline.
We got the sharp decline a 250-point one to be precise.
And in synch with the Dow decline, the euro and, crucially, gold also fell heavily.
This is highly significant, as it reinforces my view that when asset markets decline, they will do so in unison.
Surely, you might say, with turmoil in the eurozone and a flight to safety (German, US and UK bond yields are super-low as money floods into them), gold should be rocketing.
But it's not. Today I'll explain why and consider where it's heading.
Warning: You may be shocked by my conclusions, especially if you're a gold bull.
Gold like stocks is a victim of the credit implosion
Understand that the key driver in the markets is liquidity available cash and credit to speculate with.
The problem is, outstanding credit is imploding. Loans are being called. And there is little appetite for individuals and companies to take on any new credit. The drive is on to repay existing loans and banks are suffering that's why their share prices are depressed.
And as we can see, this is hitting gold too.
The longs are selling out to raise cash either to repay loans, or to put it on deposit for the rainy days they see lying ahead. Our washed-out British summer is a cruel and appropriate backdrop to this, is it not?
The way I see it, the gold market, along with fixed interest (bonds), is the most sensitive barometer of the public's opinion of economic conditions for the future.
Gold had its massive bull market until last year in parallel with growing economies and rising stock markets. Now, we're seeing what the public believes will be the trend for 2012 and beyond.
But you're here for the charts. So let's see what they're saying about gold.
Will gold's line in the sand' hold this time?
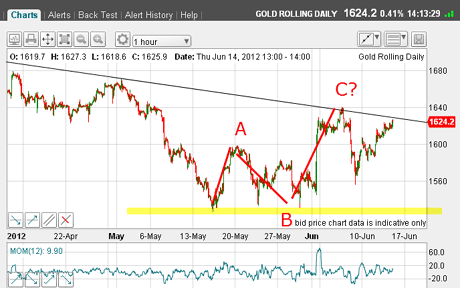
I last covered gold on 15 Juneand showed this chart:
(Click on the chart for a larger version)
The market had declined into the 16 May low at the $1,530 area and then staged a relief rally in the classic A-B-Cformat.
Well that major supportline at $1,530 has been challenged twice since. Both times it has repelled attempts at a break. As I've said before, this area is the crucial line in the sand for the bulls.
On 16 May , I noted that the long-term tramlinedrawn off last year's $1,920 top was holding at my wave C top, but was being challenged again as I wrote.
My conclusion was thatsomething has to give. Either we would see a huge upside move as the tramline resistance gave way, or the tramline would hold and we could expect another challenge of the $1,530 area.
There is powerful resistance at the tramline and just as powerful support at the $1,530 area. Moves through either should be explosive.
Sadly, I hold no crystal ball to say for certain which option the market would take and neither does anyone else. We must wait for signals from the market.
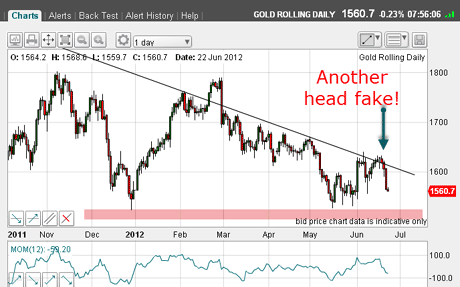
But yesterday, my question was answered in spades. Despite the potentially nasty head fake above my tramline, the market decided the resistance was too strong and appears now headed back to the $1,530 area (pink bar):
(Click on the chart for a larger version)
Trading gold can be very frustrating, especially if, like me, you like to limit risk by placing stops which are likely to be picked off!
But I'm willing to take a series of small losses in the expectation of riding a big winner. That's what works best for me.
There are no guarantees, of course, and that's what keeps many awake at night!
Why this wave down could have further to run
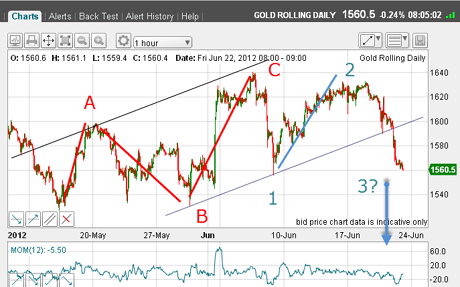
What makes me think we will see another move down to the $1,530 level? Take a look at this hourly chart:
(Click on the chart for a larger version)
The A-B-C form to the rally is clear. And I have a good pair of tramlines with the lower one decisively broken.
Incidentally, for more cautious traders, when the lower tramline was broken yesterday, a short trade could have been taken. I like the lower one with the three solid touch-points.
From the wave C top, I have wave 1 down to the lower tramline, and then a wave 2 up to meet the long-term tramline (not shown). The sharp collapse yesterday has the hallmarks of a long and strong' wave 3, which could have much further to run.
Wave 3 could end near the $1,530 area, setting up a brief wave 4 rally and then leading to a break of the $1,530 level in a fifth wave. That's my ideal scenario.
But with markets generally in third waves down and with gold in third waves of several degrees of trend moves should be fast and furious.
With the Dow and EUR/USD currently resting on important Fibonacci retracements, though, I expect a small bounce from current levels.
Third waves in three trends could mean a devastating fall
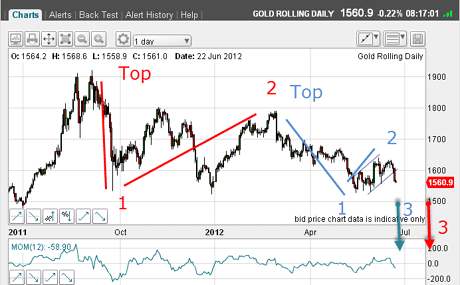
So here are my current Elliott wavelabels in gold on the daily chart:
(Click on the chart for a larger version)
On this daily chart, we have the red (very large) trend and the blue (large) trend. Put this together with the Elliott waves on the hourly chart above, and I can count three degrees of trend all in third waves.
This is one of the most powerful combinations, and if correct, portends a devastating collapse for gold in the months ahead.
But if the market can somehow rally back to the long-term tramline and break through, this would cancel my analysis. Today, the odds for this I would put much lower. I favour the collapse scenario.
Incidentally, before I go, I want to point out that many traders put great weight into what the Fed is doing/saying/intimating.
I do not, simply because the Fed or any other body is powerless to prevent the current wave of deflation sweeping the world's economies. They are market followers, not leaders.
By the way, it was interesting to see all the comments from Wednesday's article. Not everyone thinks my methods stack up and that's fair enough! We each have our own thoughts and strategies and I always like to hear other peoples' views and what works for them.
So go ahead whether you think my analysis is off the mark or whether you're finding my ideas useful or thought-provoking, let me know. You can leave your comments on today's article below.
And if you like following the euro, tune in to MoneyWeek Trader on Monday. I hope to show you then how I have been trading it (unless anything more urgent comes up in these thrilling markets!)
If you're a new reader, or need a reminder about some of the methods I refer to in my trades, then do have a look at my introductory videos:
The essentials of tramline trading
An introduction to Elliott wave theory
Advanced trading with Elliott waves
Don't miss my next trading insight. To receive all my spread betting blog posts by email, as soon as I've written them, just sign up here .