The pound is where it was two weeks ago, but a lot has gone on
The pound's volatility against the dollar has thrown up some great opportunities for swing traders, says John C Burford.
Get the latest financial news, insights and expert analysis from our award-winning MoneyWeek team, to help you understand what really matters when it comes to your finances.
You are now subscribed
Your newsletter sign-up was successful
Want to add more newsletters?

Twice daily
MoneyWeek
Get the latest financial news, insights and expert analysis from our award-winning MoneyWeek team, to help you understand what really matters when it comes to your finances.

Four times a week
Look After My Bills
Sign up to our free money-saving newsletter, filled with the latest news and expert advice to help you find the best tips and deals for managing your bills. Start saving today!
The headline on my 8 September post read: "Sterling is on its way down but the road won't be straight". Since then, the market has proven just how apt the last part of that title was.
GBP/USD, also known as 'Cable', is trading around unchanged since that date, but it has swung by around four cents up and then four cents down.
These swings have given traders an excellent opportunity to find great trades using my tramline methods. So today, I will go into detail how this could have been achieved.
MoneyWeek
Subscribe to MoneyWeek today and get your first six magazine issues absolutely FREE

Sign up to Money Morning
Don't miss the latest investment and personal finances news, market analysis, plus money-saving tips with our free twice-daily newsletter
Don't miss the latest investment and personal finances news, market analysis, plus money-saving tips with our free twice-daily newsletter
Stalking the ideal short entry

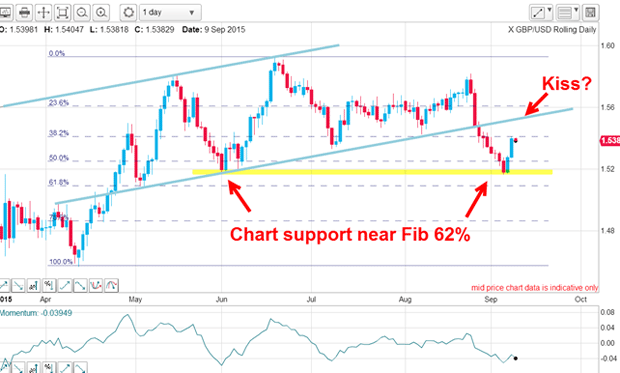
The lower tramline had been broken, and that was a sign that the trend was very probablydown. Trading with the main trend is usually the best policy.
Of course, a short-term long trade could be put on near the bounce low at the Fibonacci 62% level, expecting a rally to at least the underside of the tramline. But this would require pretty constant vigilance of your screen and if you are not able to devote much time for trading throughout the day, trading against the trend is something I do not normally advise.
So let's see if it made it to that kiss:

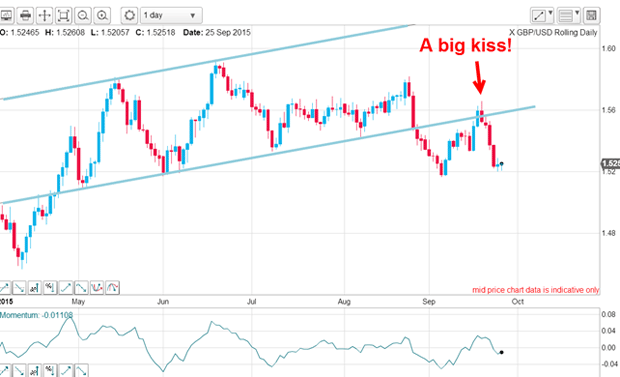
Yes, indeed it did and overshot the 'perfect' touch by some 100 pips or so. Last Thursday and Friday, the market traded well above the tramline and into the trading channel. This is normally considered a bullish development.
But because this market is notoriously 'spiky' (as I have pointed out before), more allowance must be given for possible overshoots. It is best to wait a while to see if the move above the tramline can be maintained before taking any action.
One of my rules of thumb is that when a lower tramline has been re-penetrated in a kiss overshoot, I will wait to see if it resumes its 'rightful' place below it. I will often set a sell stop order just below the line to catch any move back down.
My low-risk trade went exactly as planned
Since then, the market has dropped sharply.
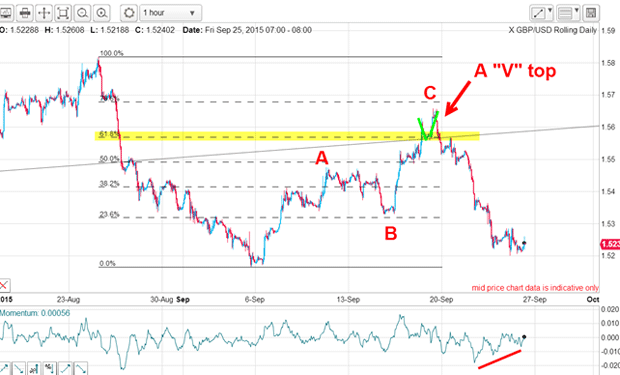
The rally is in a clear A-B-C counter-trend form and the C wave terminated just below the Fibonacci 78% level. But note the pattern at this C wave top: it is in a definite "V" shape (marked in green) with the apex of the "V" lying smack on the tramline:

How convenient! That means my 'V' trade entry method can be employed with confidence because a break of the apex of the 'V' would coincide with the break of the tramline. A sell order on a stop placed just below the 'V' apex was the correct play.
Also note that following the break, the market came back to plant a mini-kiss on the line before peeling away very sharply in a 'scalded cat bounce'; thus fulfilling one of the requirements for a genuine kiss.
So with almost 400 pips in the bag, what are the prospects for further gains to the downside? The market is currently testing the support from the early September low and there is a large positive-momentum divergence building. This indicates selling pressure is weakening and caution is advised.
The scene is set for a possible rally and short-term profits are there for the taking.
Whatever the market's next move, it's headed down
If this move occurs, a Fibonacci 50% retrace would take the market to the sub-1.54 area. But that is only one option. Another one is for the market to break below the 1.5160 low in the next few hours.
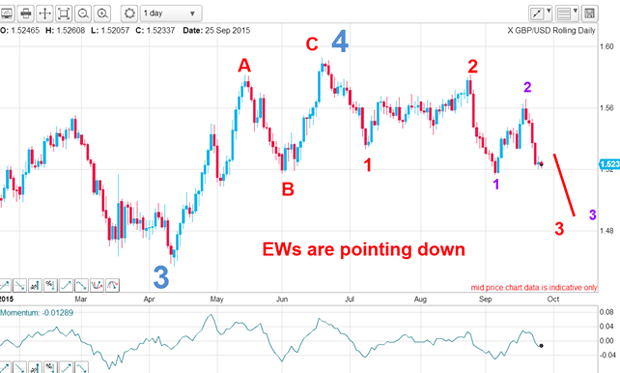
But my best guess for the Elliott wave labels remains clear: the trend is firmly down. From the wave 4 high in June, the market is tracing out a series of 1-2s and a break of the purple wave 1 low would help confirm my count. And that would herald a steeper decline in third waves of at least two degrees of trend:

What could alter my outlook?Only a move above the purple wave 2 high would put me on the sidelines.
And if this slide occurs, it would help confirm my long-standing outlook for the US dollar it is headed much higher.
Get the latest financial news, insights and expert analysis from our award-winning MoneyWeek team, to help you understand what really matters when it comes to your finances.
John is is a British-born lapsed PhD physicist, who previously worked for Nasa on the Mars exploration team. He is a former commodity trading advisor with the US Commodities Futures Trading Commission, and worked in a boutique futures house in California in the 1980s.
He was a partner in one of the first futures newsletter advisory services, based in Washington DC, specialising in pork bellies and currencies. John is primarily a chart-reading trader, having cut his trading teeth in the days before PCs.
As well as his work in the financial world, he has launched, run and sold several 'real' businesses producing 'real' products.
-
 Average UK house price reaches £300,000 for first time, Halifax says
While the average house price has topped £300k, regional disparities still remain, Halifax finds.
-
 Barings Emerging Europe trust bounces back from Russia woes
Barings Emerging Europe trust has added the Middle East and Africa to its mandate, delivering a strong recovery, says Max King