Bravery is the key to trading success
Fortune favours the brave when trading – but only if your timing is right. John C Burford looks at what he learned form a recent gold trade.
Get the latest financial news, insights and expert analysis from our award-winning MoneyWeek team, to help you understand what really matters when it comes to your finances.
You are now subscribed
Your newsletter sign-up was successful
Want to add more newsletters?

Twice daily
MoneyWeek
Get the latest financial news, insights and expert analysis from our award-winning MoneyWeek team, to help you understand what really matters when it comes to your finances.

Four times a week
Look After My Bills
Sign up to our free money-saving newsletter, filled with the latest news and expert advice to help you find the best tips and deals for managing your bills. Start saving today!
It is said that fortune favours the brave, especially in the trading world (though it rarely favours the reckless).
So was the long gold trade I outlined on 6 May a brave one?
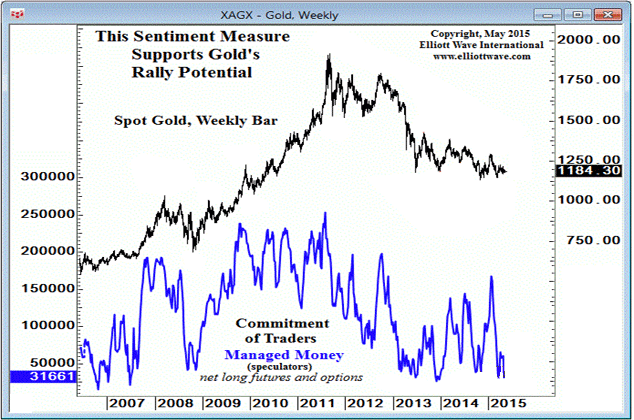
It certainly went against prevailing opinion that gold would decline. As a measure of this bearish opinion, let me show you a telling chart. The blue line is the net long position of speculators on the Comex gold market. This is an exact measure of the number of long positions less the number of short positions.
MoneyWeek
Subscribe to MoneyWeek today and get your first six magazine issues absolutely FREE

Sign up to Money Morning
Don't miss the latest investment and personal finances news, market analysis, plus money-saving tips with our free twice-daily newsletter
Don't miss the latest investment and personal finances news, market analysis, plus money-saving tips with our free twice-daily newsletter

Chart courtesy www.elliottwave.com
At the 2011 all-time high at $1,920, bullish sentiment was extreme, as was reflected in the very high net long position.
Then, as the market crashed towards the 2013 low, the net long position declined to its lows. This is a vivid demonstration that the gold market is driven by sentiment changes, not by mining data, central bank operations, nor by retail jewellery sales in China and India, and bullion sales, as so many believe.
It's sentiment changes that drive the waves on the charts that Mr Elliott, in the 1930s, first identified.
Today the net long position of speculators is near the lows, indicating that bullish sentiment is also very low. As long-time readers of mine will recognise, I consider that the ideal backdrop for a massive short squeeze rally. With sentiment about as low as it can get, there is only one way for it to go.
This follows the principle that bull markets always start from a position of low bullishness (and vice versa). To take a long trade when everyone else thinks you are crazy is not such a brave decision when viewed in this light.
Bravery is meaningless if you don't time your trades
Paradoxically, going against the herd is often the low-risk trade because your protective stops can be set quite tight. But we are all taught not to fight the trend the trend is your friend, is it not? That is the paradox.
But trends do not persist for ever, and my particular interest is in the exploitation of trend changes. If I can locate a major trend change early, I stand a good chance of extracting a very large chunk out of the subsequent swing. My tramline methods attempt to do just that.
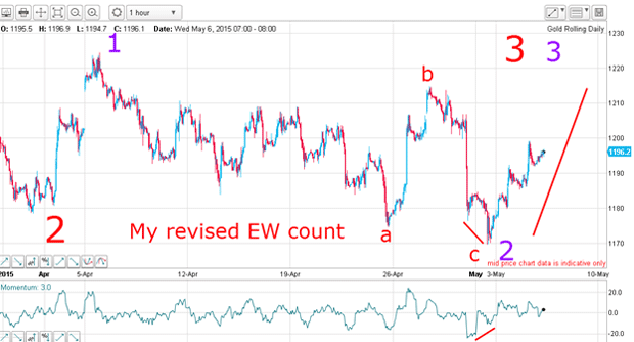
On 6 May, I wrote that the foundations had been laid "for a likely rally in wave C and the start of wave 3 But the key to my forecast was for the market to begin a sharp rally on Monday and into this week to kick off the third wave up."
I believed I had identified a significant low where I could enter a low risk trade. This is how the chart looked:

Clearly, my forecast was on track as the market kicked off on the Monday session with a rally, which continued into 6 May.
But one swallow does not a summer make. So has the rally continued, or did the market disappoint and fall back under the weight of all that negative sentiment? After all, the massed ranks of bears would be taking this opportunity to short into this rally.
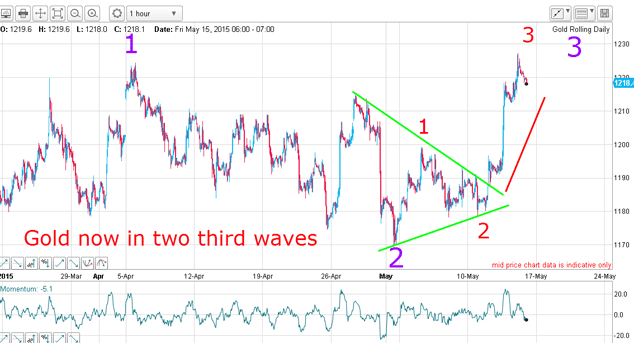
Here is the updated chart as of this morning:

After the early May low was in (my purple wave 2), the initial thrust upwards was met by selling that drove the market back down to the $1,180 region from where it staged an even more vigorous rally.
That convinced me we were in a third wave. Remember, third waves are long and strong and the initial strength this week gave the game away.
In recent days, the market has built on that strength and yesterday, the market took out the early April wave 1 (purple) high. That provided even more evidence that the trend is now firmly up. In fact, my wave labels show that gold is in two third waves of differing degrees a most powerful pattern.
Gold should continue to rally

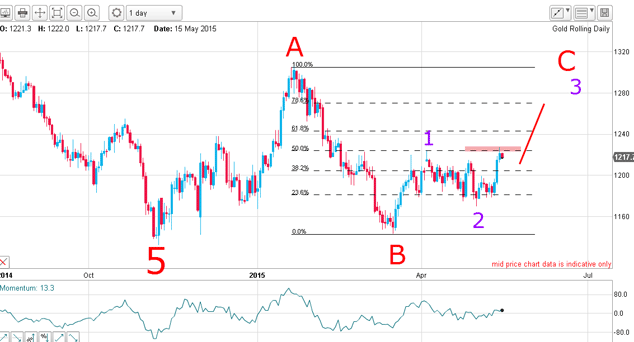
This third wave will be part of my proposed five wave structure for red wave C, which should take the market to at least as high as wave A in the $1,300 area.
So there is still a lot to go for and my trade taken on Monday 4 May remains very much on track. The only thing that could spoil the picture is for the market to suddenly turn down below $1,180, but I put that at low probability. I have my stop at break even, just in case.
Get the latest financial news, insights and expert analysis from our award-winning MoneyWeek team, to help you understand what really matters when it comes to your finances.
John is is a British-born lapsed PhD physicist, who previously worked for Nasa on the Mars exploration team. He is a former commodity trading advisor with the US Commodities Futures Trading Commission, and worked in a boutique futures house in California in the 1980s.
He was a partner in one of the first futures newsletter advisory services, based in Washington DC, specialising in pork bellies and currencies. John is primarily a chart-reading trader, having cut his trading teeth in the days before PCs.
As well as his work in the financial world, he has launched, run and sold several 'real' businesses producing 'real' products.
-
 MoneyWeek Talks: The funds to choose in 2026
Podcast Fidelity's Tom Stevenson reveals his top three funds for 2026 for your ISA or self-invested personal pension
-
 Three companies with deep economic moats to buy now
Opinion An economic moat can underpin a company's future returns. Here, Imran Sattar, portfolio manager at Edinburgh Investment Trust, selects three stocks to buy now