Gold took a nosedive, but my bullish roadmap didn’t change
The market in gold may have collapsed before the weekend. But John C Burford explains why he's sticking to his guns.
Get the latest financial news, insights and expert analysis from our award-winning MoneyWeek team, to help you understand what really matters when it comes to your finances.
You are now subscribed
Your newsletter sign-up was successful
Want to add more newsletters?

Twice daily
MoneyWeek
Get the latest financial news, insights and expert analysis from our award-winning MoneyWeek team, to help you understand what really matters when it comes to your finances.

Four times a week
Look After My Bills
Sign up to our free money-saving newsletter, filled with the latest news and expert advice to help you find the best tips and deals for managing your bills. Start saving today!
On 29 April, I noted that I had called the short-term twists and turns in goldpretty well. That was, until last Friday. On that day, the market fell hard.
Today, I will explain what action I took and how I amended my wave labels.
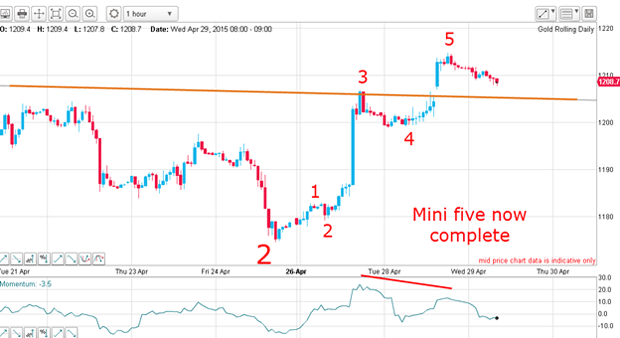
On 29 April, the rally off the wave 2 low was in a clear five waves, which was probably complete. There was a large negative-momentum divergence at the wave 5 high. Clearly, that high was a great place to take short-term profits; following a five-wave move, a three-wave decline to either a Fibonacci 50% or 62% retrace is the percentage forecast (but not 100%, of course).
MoneyWeek
Subscribe to MoneyWeek today and get your first six magazine issues absolutely FREE

Sign up to Money Morning
Don't miss the latest investment and personal finances news, market analysis, plus money-saving tips with our free twice-daily newsletter
Don't miss the latest investment and personal finances news, market analysis, plus money-saving tips with our free twice-daily newsletter

I believed we were at the start of a wave 3 up. "Remember," I wrote, "a motive five-wave count is always in the same direction as the one larger trend."
However, at yesterday's [April 28] high at $1,215, there is a yawning momentum divergence. There will likely be a pull-back, but where to, and in what form?
Naturally, a move back down to the major support line is one possibility. I would like to see a mini A-B-C where the C wave lies at or near that support line."
So how did that work ?
How my charts predicted the bounce-back

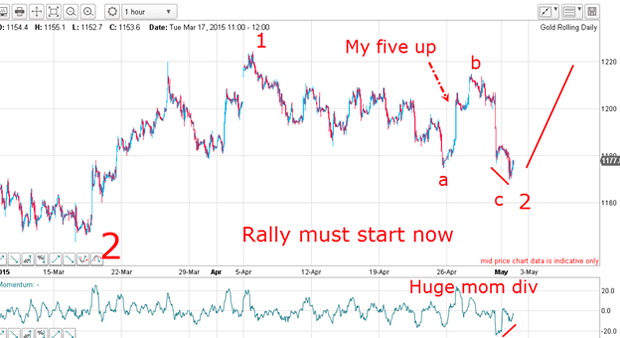
That decline forced me to re-assess my Elliott wave count. Now I had an a-b-c pattern with the c wave lying under the a wave (this is perfectly allowable) and with a useful momentum divergence. If I was correct, Friday's low was likely to be the small red wave 2 low as well.
Now, I am able to label the up-down sequence as a corrective three-wave affair.
Like my new a wave, my c wave sports a five-wave pattern, which is typical for c waves.
Obviously, if you were long from the $1,210 area, your close protective stop would have been touched on the decline and you would have suffered a loss. But would you have given up in disappointment after expecting a big rally?
The form of the c wave decline is a five-wave affair, and Friday's low took the market back to the Fibonacci 62% region of the entire rally off the big wave 2 low.
That laid the ground for a likely rally in wave C and the start of wave 3. To me, that was the most likely outcome as of last weekend.
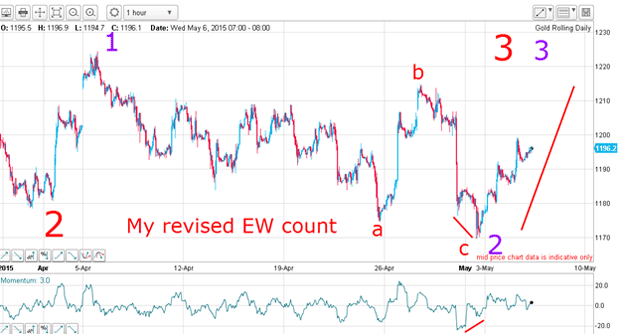
But the key to my forecast was for the market to begin a sharp rally on Monday and into this week to kick off the third wave up.
This pointed to another long trade as soon as possible with protective stop just beneath Friday's low. And if my forecast was wrong, only a small loss would be taken.
Remember, my aim in the business of trading is not to be proved right with all the bragging rights that that entails it is to lose as little as possible on my losers and let the winners take care of themselves.
That is why good traders do not fear a losing trade, provided it has been made with a disciplined approach.
The rally went as I expected, and it should go further

If this is correct, this combination of two third waves (which is one of the most powerful motive patterns) should soon propel the market above the wave b high and then on to the $1,220 wave 1 high. Higher targets then come into play.
This is an excellent example of using basic Elliott wave theory to forecast a particular action up ahead, and then observing that action in real time. This provides powerful confirmation of your original road map.
The key observation is this: if the market does not act according to your forecast, then you will need to quickly go back to the drawing board. That is one of the most useful features of Elliott wave theory: it gives you specific action to look for. That allows you to escape from a busted forecast with minimal loss.
But so far, my gold forecast is working perfectly, and my early Monday trade can now be protected by moving my stop to break even.
What would negate my forecast? A move below Friday's low would certainly be a cause for concern. But with my protective stop at break even, I would suffer zero loss. That is a happy position for any trader to be in!
Get the latest financial news, insights and expert analysis from our award-winning MoneyWeek team, to help you understand what really matters when it comes to your finances.
John is is a British-born lapsed PhD physicist, who previously worked for Nasa on the Mars exploration team. He is a former commodity trading advisor with the US Commodities Futures Trading Commission, and worked in a boutique futures house in California in the 1980s.
He was a partner in one of the first futures newsletter advisory services, based in Washington DC, specialising in pork bellies and currencies. John is primarily a chart-reading trader, having cut his trading teeth in the days before PCs.
As well as his work in the financial world, he has launched, run and sold several 'real' businesses producing 'real' products.
-
 Average UK house price reaches £300,000 for first time, Halifax says
While the average house price has topped £300k, regional disparities still remain, Halifax finds.
-
 Barings Emerging Europe trust bounces back from Russia woes
Barings Emerging Europe trust has added the Middle East and Africa to its mandate, delivering a strong recovery, says Max King