Gold’s defying the bears, but for how long?
As a swing trader, you must keep an open mind on gold, says John C Burford. Follow your analysis of the charts.
Get the latest financial news, insights and expert analysis from our award-winning MoneyWeek team, to help you understand what really matters when it comes to your finances.
You are now subscribed
Your newsletter sign-up was successful
Want to add more newsletters?

Twice daily
MoneyWeek
Get the latest financial news, insights and expert analysis from our award-winning MoneyWeek team, to help you understand what really matters when it comes to your finances.

Four times a week
Look After My Bills
Sign up to our free money-saving newsletter, filled with the latest news and expert advice to help you find the best tips and deals for managing your bills. Start saving today!
As a gold trader, one of the benefits of scanning articles and blogs on the metal which are never hard to find, since it seems everyone and his dog has an opinion on gold is that occasionally, you find one author in particular that is (in your opinion) consistently wrong with his or her calls and with perfect timing. This can be very useful information.
I have a writer who performs that role for me. I will not mention his name, but this is the title of his latest article published on Monday (and probably written on the weekend when gold closed down on the week): "Gold all signals point south".
Because I am a gold bull (at the moment), I was curious to read his article to see how he reached that polar opposite conclusion. And this is a useful habit. Traders should keep open minds and read opposing arguments to judge the strength of their own.
MoneyWeek
Subscribe to MoneyWeek today and get your first six magazine issues absolutely FREE

Sign up to Money Morning
Don't miss the latest investment and personal finances news, market analysis, plus money-saving tips with our free twice-daily newsletter
Don't miss the latest investment and personal finances news, market analysis, plus money-saving tips with our free twice-daily newsletter
And what a contrast in methods the author uses fundamental analysis mining data, China and India demand figures (and conjectures), and the state of the rampant US dollar.
In fact, the author lays out a perfectly logical case for gold to decline. And it may well do so, but where will it head first? Will it zoom up to $1,500 before declining? Or will it simply head straight down with no intervening rally phase?
That is the burning question on the mind of the technical swing trader. After all, profits or losses depend on correctly answering it.
All of these data inputs require an interpretation, but it all boils down to one thing: do you feel bullish or bearish on the figures?
Your opinion is less important than what the herd thinks
The most useful attitude is not to take one side regardless of what other traders think, but to get a handle on what the majority of other traders think and base your conclusions on that. And that involves use of published sentiment data and also the COT (commitments of traders) weekly figures.
But I have reached the opposite conclusion based on the charts and sentiment data.
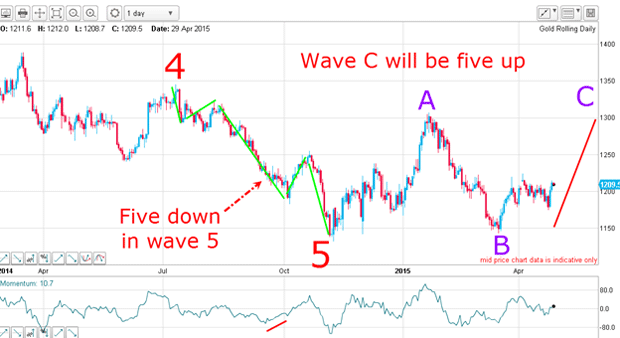
My daily chart (complete with long-standing Elliott waves) is below. When wave 5 terminated last November, I was able to forecast an A-B-C corrective rally pattern, in accordance with the basic Elliott wave principle of five down, then three up. That was my road map.

On cue, wave A formed and topped in January. Then wave B down took the market to below the $1,150 level as it challenged, but did not exceed, the wave 5 low.
The market then embarked on the C wave with an initial strong thrust to the $1,220 level. My first long trade was early in the C wave at the $1,160 region.
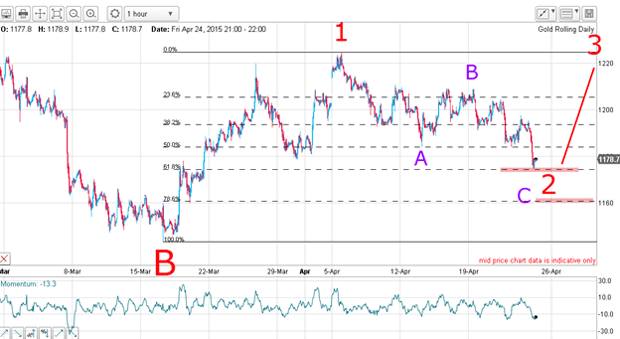
I then monitored its progress and noted the pull-back in April to last Friday's low at the $1,160 area. A chart I pulled this weekend showed that the decline off the 5 April high was in a clear A-B-C (marked in purple).

I believed that would be the extent of the decline, since it was hitting the usual Fibonacci 62% turn-around support level (marked in pink).
That placed the market in a highly probable rally off that level. If that rally came, we would be in a long and strong wave 3 as part of my ultimate five-wave C wave.
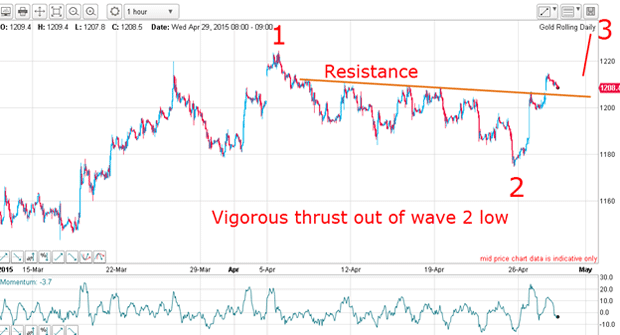
On that basis, on Monday I was looking for a vigorous thrust up and got it. I drew in a very solid line of resistance and the market simply pushed up hard through it yesterday at the $1,205 area. That line is now support.

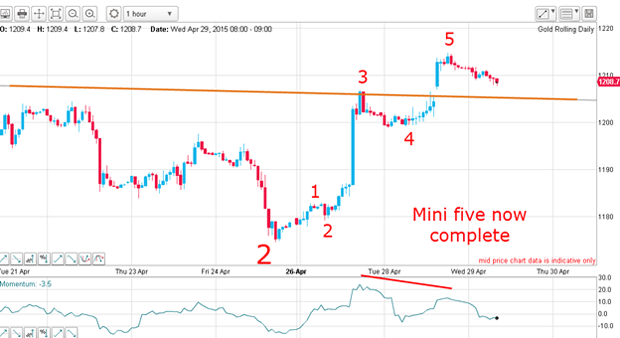
The market has been following my road map perfectly, and the short-term chart seems to suggest that it won't hit any roadblocks. From the wave 2 low, I have a beautiful and complete five up. Wave 3 really stands out as being strong, if not very long!

That reinforces my belief that we are at the start of wave 3 up. Remember, a motive five wave count is always in the same direction as the one larger trend.
However, at yesterday's high at $1215, there is a yawning momentum divergence. There will likely be a pull-back, but where to, and in what form?
Naturally, a move back down to the major support line is one possibility. I would like to see a mini A-B-C where the C wave lies at or near that support line.
It's worth noting that there is a gap on the above hourly chart which acts as a magnet, so closing that gap would be entirely expected before the rally can resume.
An alternative outcome would be a further move up in an extension of wave 5 before a decent correction can be mounted.
Get the latest financial news, insights and expert analysis from our award-winning MoneyWeek team, to help you understand what really matters when it comes to your finances.
John is is a British-born lapsed PhD physicist, who previously worked for Nasa on the Mars exploration team. He is a former commodity trading advisor with the US Commodities Futures Trading Commission, and worked in a boutique futures house in California in the 1980s.
He was a partner in one of the first futures newsletter advisory services, based in Washington DC, specialising in pork bellies and currencies. John is primarily a chart-reading trader, having cut his trading teeth in the days before PCs.
As well as his work in the financial world, he has launched, run and sold several 'real' businesses producing 'real' products.
-
 MoneyWeek Talks: The funds to choose in 2026
Podcast Fidelity's Tom Stevenson reveals his top three funds for 2026 for your ISA or self-invested personal pension
-
 Three companies with deep economic moats to buy now
Opinion An economic moat can underpin a company's future returns. Here, Imran Sattar, portfolio manager at Edinburgh Investment Trust, selects three stocks to buy now