Are stockmarkets warning of a depression?
Correctly forecasting the moment the bull-market turned was no lucky guess, says John C Burford. The signs were in the charts all along.
Get the latest financial news, insights and expert analysis from our award-winning MoneyWeek team, to help you understand what really matters when it comes to your finances.
You are now subscribed
Your newsletter sign-up was successful
Want to add more newsletters?

Twice daily
MoneyWeek
Get the latest financial news, insights and expert analysis from our award-winning MoneyWeek team, to help you understand what really matters when it comes to your finances.

Four times a week
Look After My Bills
Sign up to our free money-saving newsletter, filled with the latest news and expert advice to help you find the best tips and deals for managing your bills. Start saving today!
Two days before the stockmarket made its all-time top in the Dow at 17,365 on 19 September, I wrote: "This is an important week in the markets, make no mistake. As we approach the end of September traditionally one of the weakest months for stock markets there are several events that are potentially market-changing."
Is this the start of a major collapse or a buying opportunity?
I believe the date of 19 September will go down in the annals of stockmarket history as marking the all-time top of the Dow.
That 1,000 point-plus decline is almost 6% and has taken 17 days. It now trades at the same level as in August. The rally from the August low took 30 days almost twice as long as the decline.
MoneyWeek
Subscribe to MoneyWeek today and get your first six magazine issues absolutely FREE

Sign up to Money Morning
Don't miss the latest investment and personal finances news, market analysis, plus money-saving tips with our free twice-daily newsletter
Don't miss the latest investment and personal finances news, market analysis, plus money-saving tips with our free twice-daily newsletter
In Monday'spost, I noted that the A-B-C declines in 2012 had a similar time relationship the declines took about half the time as the rallies for the same price difference. I have found that this is a common feature in large markets.
To very accurately forecast a major turn following a 66-month roaring bull market was no lucky guess. I arrived at it using my tramline methods and the all-important sentiment data.
But is this the start of a major collapse, or another buying opportunity? That is the question all are asking. Most people will talk their book. If they own shares, they will discount the idea of a major collapse. That is natural and provides the fuel for bear market selling when they can stand the pain of loss no more as markets decline.
And it is impossible to answer definitively, of course. But as a trader, rather than an investor, that question is almost irrelevant. I am interested in following the path of least resistance, whichever way the market takes me.
That is not to say I will not consider taking a long-term position. In fact, since I managed to catch the all-time high, which I do not expect the market to exceed for a very long time, this is one occasion when I can be relaxed about carrying a long-term trade.
I know I will see sharp rallies along the way, but unless the market takes out my break-even stop, I can afford to stay with the trade as long as it takes.
What the charts are telling us
There is no question that risk is being shunned and small caps are therefore weaker than the blue chips.
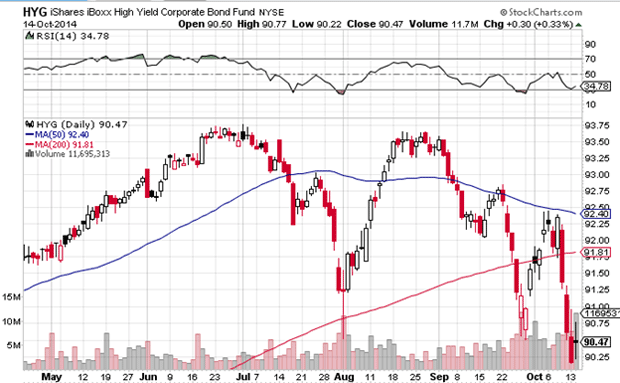
Junk bonds are some of the riskiest on the bond board and the chart isn't pretty (for the bulls):

Chart courtesy stockcharts.com
Support levels have given way, and note that trading volumes are decreasing on rallies and increasing on declines a bearish sign. The twin peaks make up a classic double top. This chart is ominous for stocks and bonds of all stripes.
Let's review other stock indexes.
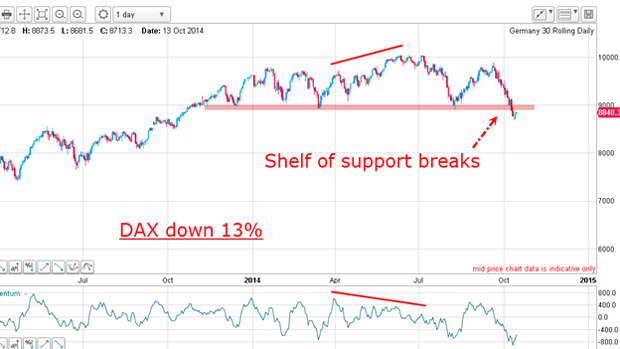
German DAX
It has now lost 13% and broken a key level of support:

There was plenty of warning for an impending decline with the very large negative-momentum divergence going into the high. And note the high occurred at the round-number 10,000 level (see S&P 500 chart below). Hmm.
Also, there is a head and shoulders top pattern on this daily chart, and this is a reversal pattern. The trend has changed.
S&P500

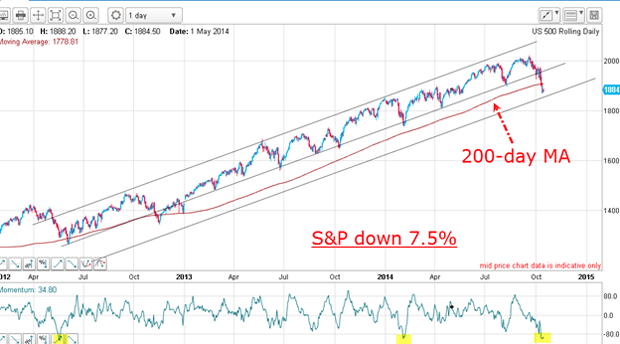
I do not use moving averages for trading, but a lot of institutional investors do and here is their most-watched 200-day moving average. The market has clearly broken below it for the first time in almost two years. This is not a bullish development.
But the sharp decline has taken the market close to my third tramline, which is normally a place of support. Also, momentum has reached oversold levels from where previous rallies have started. A decent bounce is possible, but if the market cannot stage one soon, further sharp losses are on the cards.
Note that the top was reached at the round-number 2,000 level (see DAX).
FTSE 100
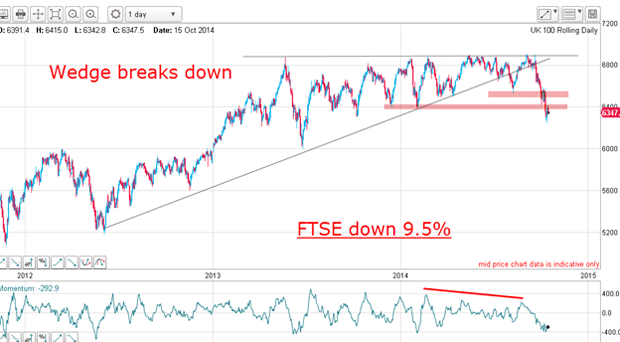
Resource companies have been hit especially hard as commodity prices have slumped, and the FTSE contains many of these multi-nationals:

Again, important support levels have been breached, but momentum has reached oversold levels. This is no guarantee that the market will recover, though. During heavy selling periods, markets have no respect for support or oversold levels.
Because the very clear wedge pattern has been broken, my major lower target is the start of the wedge namely the 5,200 area.
Is the bubble ready to burst?
At the start of this post, I asked whether the markets are warning of a depression. Such a thought was hardly on anyone's mind only a few short weeks ago, and anyone suggesting it was considered a crank (or worse).
With these huge losses since 19 September, more people are coming round to the possibility. After all, there are record levels of debt in the financial system and asset prices have been propped up by record low interest rates in recent years.
The belief that stockmarkets are in bubbles waiting for a pin to show up is gathering steam. I have had that belief for many months.
Get the latest financial news, insights and expert analysis from our award-winning MoneyWeek team, to help you understand what really matters when it comes to your finances.
John is is a British-born lapsed PhD physicist, who previously worked for Nasa on the Mars exploration team. He is a former commodity trading advisor with the US Commodities Futures Trading Commission, and worked in a boutique futures house in California in the 1980s.
He was a partner in one of the first futures newsletter advisory services, based in Washington DC, specialising in pork bellies and currencies. John is primarily a chart-reading trader, having cut his trading teeth in the days before PCs.
As well as his work in the financial world, he has launched, run and sold several 'real' businesses producing 'real' products.
-
 Inheritance tax investigations net HMRC an extra £246m from bereaved families
HMRC embarked on almost 4,000 probes into unpaid inheritance tax in the year to last April, new figures show, in an increasingly tough crackdown on families it thinks have tried to evade their full bill
-
 Average UK house price reaches £300,000 for first time, Halifax says
While the average house price has topped £300k, regional disparities still remain, Halifax finds.