How to trade a third wave in the charts
Third waves in the charts can make for rocky rides, says John C Burford. But if you can hang on, they can be very profitable.
Get the latest financial news, insights and expert analysis from our award-winning MoneyWeek team, to help you understand what really matters when it comes to your finances.
You are now subscribed
Your newsletter sign-up was successful
Want to add more newsletters?

Twice daily
MoneyWeek
Get the latest financial news, insights and expert analysis from our award-winning MoneyWeek team, to help you understand what really matters when it comes to your finances.

Four times a week
Look After My Bills
Sign up to our free money-saving newsletter, filled with the latest news and expert advice to help you find the best tips and deals for managing your bills. Start saving today!
In my book Tramline Trading, I list my five favourite trade setups. One of these is the third wave. Today, I want to show how to put the odds on your side when trying to identify these very profitable moves.
One point to keep in mind is that a third wave is often the longest and strongest wave in a sequence. If you can latch onto a third wave, it is like catching a tiger by its tail it is a very wild ride, but often very profitable so long as you can hang on.
In a 1-2-3-4-5 wave motive pattern, the third wave is reasonably easy to identify, but only after it has been in motion for some time. At some point along its travel, the momentum readings reach very low (in a bear move) or very high (in a bull move) levels. In fact, this is often the third wave give-away.
MoneyWeek
Subscribe to MoneyWeek today and get your first six magazine issues absolutely FREE

Sign up to Money Morning
Don't miss the latest investment and personal finances news, market analysis, plus money-saving tips with our free twice-daily newsletter
Don't miss the latest investment and personal finances news, market analysis, plus money-saving tips with our free twice-daily newsletter
Of course, the great difficulty arises when the third wave is just getting under way, before it has become apparent that the move is becoming relentlessly one-way. Get in too early and you could well be whipsawed. Get in too late and you have missed most of the move.
The other important point is that the C wave of an A-B-C pattern is also a third wave, and can have many of the same characteristics as does the motive third wave.
The really big picture
On the large scale, here is a fine example of a third C wave I showed on Wednesday in the Dow:
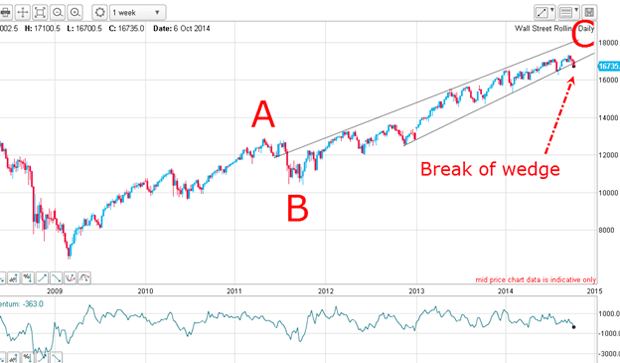
The C wave is longer than the A wave (which is long and strong itself!).
Here is that B wave in 2011:
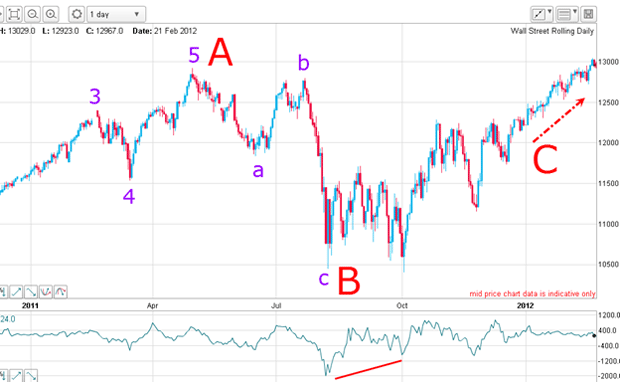
The A wave top coincided with the smaller-scale wave 5 top, then a small scale a-b-c down to the wave B low and then the start of wave C. I say small scale a-b-c' but the decline was almost 2,500 points, or 20% a very tradable run.
I remember it well, because the break of the a wave was an ideal place to enter a short trade. In any case, the c wave was long and strong in that it was over twice the extent of the a wave and took only half as long to complete.
Also, note the large positive-momentum divergence at the two lows.
Now, if we have completed the big C wave at the 19 September high, this completes the very big Elliott wave picture:
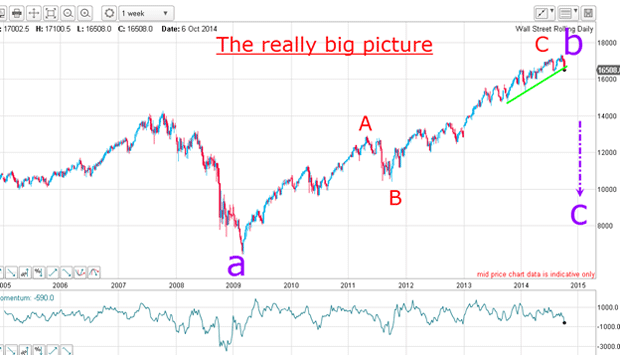
The March 2009 low was a very large a wave low and the September high completes the very large b wave. We are now entering the very large c wave down. This third wave has the potential, based on the previous example, of extending at least twice the length of the a wave in one half of the time.
I will let you do the maths.
Aglitch in Microsoft?
Now, here is the daily chart of Microsoft, a leading global tech company and it shows a very interesting development:
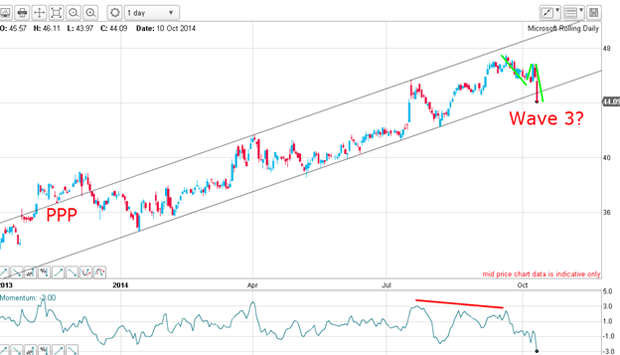
I have excellent tramlines starting in 2013. The upper line has a nice PPP (prior pivot point) and the lower line has multiple accurate touch points. Any break of this lower line is likely to be highly significant and on Friday, that is precisely what has happened.
The moves off the high could be the start of a big move down with Friday's decline posing as the start of a third wave it has certainly started out as a strong wave.
Where is a good entry if you believe you have a third wave starting? Good question! After all, we are only looking for a low-risk entry.
Do you have a Microsoft tiger by the tail?
Here is the hourly chart:
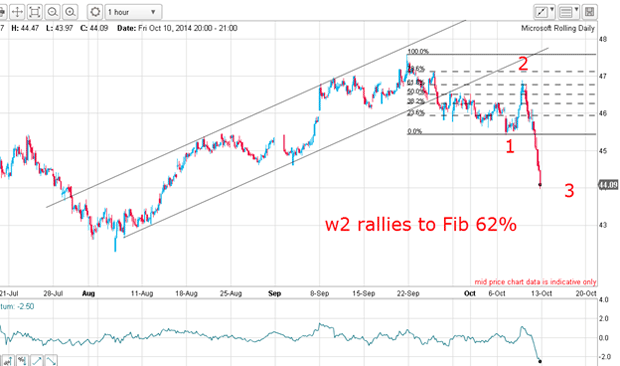
The rally since August is well contained by my tramlines and the lower line was broken on 25 September. And according to my tramline trading rule, that was the place to enter short sales (or to take profits on longs).
Following the break the market drifted down, staged a rally to the Fibonacci 62% retrace in wave 2, and then fell hard on Friday in what could well be wave 3 down.
That rally in wave 2 was another low-risk place to enter short trades.
Note that the market was not strong enough in this second wave to plant a traditional kiss on the lower tramline. That is a sign of weakness and provides a strong clue that the path of least resistance is now down as the market proved on Friday.
Incidentally, this is a great stock to trade. It trades in very high volumes and surprises are few. It conforms to my tramlines and Elliott wave levels about as well as the stock indexes I follow.
So now, do you have a Microsoft tiger by the tail?
Get the latest financial news, insights and expert analysis from our award-winning MoneyWeek team, to help you understand what really matters when it comes to your finances.
John is is a British-born lapsed PhD physicist, who previously worked for Nasa on the Mars exploration team. He is a former commodity trading advisor with the US Commodities Futures Trading Commission, and worked in a boutique futures house in California in the 1980s.
He was a partner in one of the first futures newsletter advisory services, based in Washington DC, specialising in pork bellies and currencies. John is primarily a chart-reading trader, having cut his trading teeth in the days before PCs.
As well as his work in the financial world, he has launched, run and sold several 'real' businesses producing 'real' products.
-
 Average UK house price reaches £300,000 for first time, Halifax says
While the average house price has topped £300k, regional disparities still remain, Halifax finds.
-
 Barings Emerging Europe trust bounces back from Russia woes
Barings Emerging Europe trust has added the Middle East and Africa to its mandate, delivering a strong recovery, says Max King