Have stocks started the long road down?
The bulls are battling the bears in the Dow, says John C Burford. The market will move in the direction of whichever side wins.
Get the latest financial news, insights and expert analysis from our award-winning MoneyWeek team, to help you understand what really matters when it comes to your finances.
You are now subscribed
Your newsletter sign-up was successful
Want to add more newsletters?

Twice daily
MoneyWeek
Get the latest financial news, insights and expert analysis from our award-winning MoneyWeek team, to help you understand what really matters when it comes to your finances.

Four times a week
Look After My Bills
Sign up to our free money-saving newsletter, filled with the latest news and expert advice to help you find the best tips and deals for managing your bills. Start saving today!
Members of the Trade for Profit Academy are moving their skills up level by level as they work through the modules and exercises I have set. But one of the important benefits of being a member is that they can fire questions at me on the members' forum.
Last week, a few members were debating the correct Elliott waves (EW)in the Dow. I haven't covered the Dow for some time, so this gives me that opportunity.
The battle between the bulls and the bears
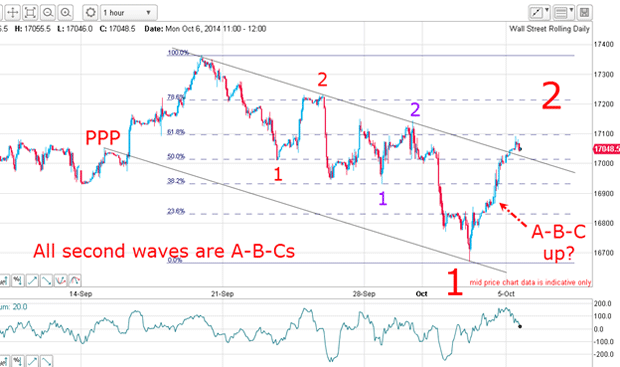
This was the chart I posted on the forum on Monday:
MoneyWeek
Subscribe to MoneyWeek today and get your first six magazine issues absolutely FREE

Sign up to Money Morning
Don't miss the latest investment and personal finances news, market analysis, plus money-saving tips with our free twice-daily newsletter
Don't miss the latest investment and personal finances news, market analysis, plus money-saving tips with our free twice-daily newsletter

The down moves off the 19 September high is a series of 1-2s. This is a series of wave 1 down and wave 2 up. I call this a stair-step pattern. And it is entirely typical of market moves when an important top has been made and a new trend is beginning as it does in fits and starts.
I have decent, but not ideal, tramlines.
To me, a topping process appears as a battle between the forces of the bulls who have enjoyed a 66-month uptrend, and the bears who are eyeing the deteriorating economic picture. A mixture of profit-taking and new short selling produces the first waves down, while the knee-jerk reaction of the bulls, accustomed as they have been to their profitable habit of buying the dips, produce the wave 2 rallies.
But at some point, one of these forces dominates and the market moves sharply in one direction. And since Monday, the bears have been in control.
How to save yourself a lot of grief
Note that all of my second waves are three-wave A-B-Cs, which is a stand-out feature of counter-trend moves. In fact, I use this observation to ensure I have the direction right. It is one of my top clues.
With Elliott wave theory (EWT), we have the benefit of knowing when we are wrong in our count and a natural exit point. This is invaluable information as you can abandon trades when this occurs and save yourself a lot of grief. In this case, a move above any wave 2 high would negate the count.
But so long as these highs are not violated, the count remains valid.
The implication of course is that the market is in a series of overlapping third waves. This is an invaluable insight, because it strongly suggests that the next move will be a powerful series of waves down. Only EWT can give you this crystal-clear insight.
The ideal place for a turn and a trade entry
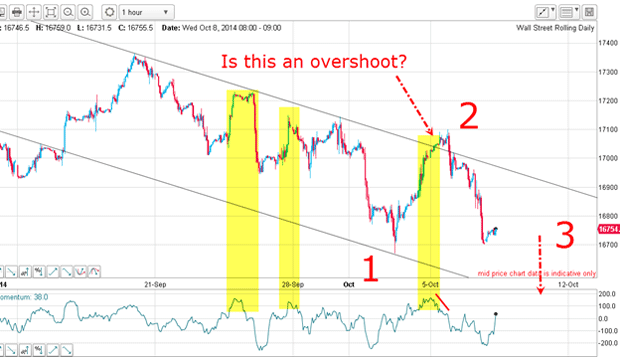
Here is the updated hourly chart:

After posting my Monday chart, the market started to move sharply lower in confirmation of my EW labels.
But the fly in the ointment was the upper tramline break, which is usually a warning sign that the next move could be higher. As it turned out, that was an overshoot, which gets you into a whipsaw trade if going long on the break. Nasty.
But a clue that there was little bullish gas left in the tank was the overbought momentum reading. When momentum had reached this elevated level previously, a top was made (see the highlighted bars). If history is any guide and it usually is we could expect a top, rather than a continuation of the rally.
Also, the momentum was declining into Monday's top (red bar), which provided another clue that the next move was likely to be down. And one more thing the rally to 17,100 was a precise Fibonacci 62% retrace. What an ideal place for a turn and a trade entry!
What I do when I see a tramline overshoot
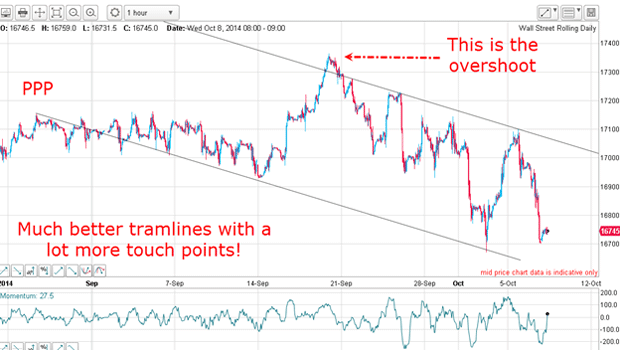
Whenever I see a tramline overshoot, I always like to see if I can set different tramlines. Using the Monday high as a touch point, this is what I came up with:

That's much better and now the top is the real overshoot. That makes sense because if the top at 17,365 is the all-time high, as I strongly suspect it is, it represents the last blow-off buying spree that usually caps off a major Dow bull market.
Now I have a PPP (prior pivot point) on the lower line as well as multiple accurate touch points. And the upper line has three accurate touch points the bare minimum for me to consider it secure.
The second time lucky?
So, now I have a downside target on the lower tramline. Depending on how long the market takes to get there, it is currently in the 16,500 to 16,600 area.
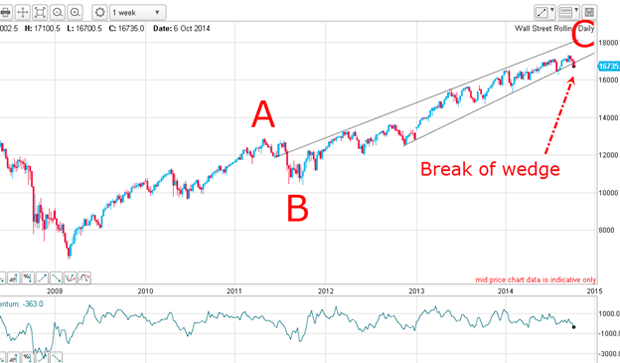
With this development, it is time to look at the bigger picture again:

This is the weekly chart of the entire rally off the 2009 plunge low and shows the A-B-C form I have been using for many months. Now, with the move off the 19 September top, the lower wedge line has been broken. The first time that occurred was the head fake in August.
The question is: is this break the second time lucky?
If so, I have long-term targets which lie all the way down to the 2009 low. Remember, the A-B-C pattern is counter-trend and when the C wave terminates, the market very often moves more swiftly down that it did on the upswing.
Markets fall out of the window faster than they climb the stairs.
Get the latest financial news, insights and expert analysis from our award-winning MoneyWeek team, to help you understand what really matters when it comes to your finances.
John is is a British-born lapsed PhD physicist, who previously worked for Nasa on the Mars exploration team. He is a former commodity trading advisor with the US Commodities Futures Trading Commission, and worked in a boutique futures house in California in the 1980s.
He was a partner in one of the first futures newsletter advisory services, based in Washington DC, specialising in pork bellies and currencies. John is primarily a chart-reading trader, having cut his trading teeth in the days before PCs.
As well as his work in the financial world, he has launched, run and sold several 'real' businesses producing 'real' products.
-
 ISA fund and trust picks for every type of investor – which could work for you?
Whether you’re an ISA investor seeking reliable returns, looking to add a bit more risk to your portfolio or are new to investing, MoneyWeek asked the experts for funds and investment trusts you could consider in 2026
-
 The most popular fund sectors of 2025 as investor outflows continue
It was another difficult year for fund inflows but there are signs that investors are returning to the financial markets