Are stock markets poised for a decline?
Extremely bullish sentiment has propelled stocks higher, says John C Burford. So, a reversal to the bear side could have dramatic results.
Get the latest financial news, insights and expert analysis from our award-winning MoneyWeek team, to help you understand what really matters when it comes to your finances.
You are now subscribed
Your newsletter sign-up was successful
Want to add more newsletters?

Twice daily
MoneyWeek
Get the latest financial news, insights and expert analysis from our award-winning MoneyWeek team, to help you understand what really matters when it comes to your finances.

Four times a week
Look After My Bills
Sign up to our free money-saving newsletter, filled with the latest news and expert advice to help you find the best tips and deals for managing your bills. Start saving today!
When I recently covered the progress of the FTSE 100, I pointed out the large divergence between that index and the more speculative ones, such as the Nasdaq and our own FTSE 250 mid-cap index.
The small caps have been powering ever upwards, leaving the more mature FTSE (and the DJIA) in the dust.
This reach for risk is so pronounced that even Twitter can launch its IPO (initial public offering) with a valuation of around $20bn while the company is losing money. This has shades of the dotcom boom in the late 1990s. And we all remember how that ended.
MoneyWeek
Subscribe to MoneyWeek today and get your first six magazine issues absolutely FREE

Sign up to Money Morning
Don't miss the latest investment and personal finances news, market analysis, plus money-saving tips with our free twice-daily newsletter
Don't miss the latest investment and personal finances news, market analysis, plus money-saving tips with our free twice-daily newsletter
But maybe this time is different.
The bears are outnumbered
| (Nasdaq 100 stock index x $20) | Row 0 - Cell 1 | Row 0 - Cell 2 | Row 0 - Cell 3 | Open interest: 397,534 | ||||
| Commitments | ||||||||
| 127,296 | 13,522 | 1,401 | 238,820 | 359,131 | 367,517 | 374,054 | 30,017 | 23,480 |
| Changes from 11/12/13 (Change in open interest: 249) | ||||||||
| -12,042 | -4,696 | 1,068 | 11,264 | 629 | 290 | -2,999 | -41 | 3,248 |
| Percent of open in terest for each category of traders | ||||||||
| 32.0 | 3.4 | 0.4 | 60.1 | 90.3 | 92.4 | 94.1 | 7.6 | 5.9 |
| Number of traders in each category (Total traders: 214) | ||||||||
| 76 | 24 | 11 | 69 | 61 | 147 | 94 | Row 8 - Cell 7 | Row 8 - Cell 8 |
The hedge funds (non-commercials) reduced their long exposure in the last week, but still retain a massively bullish position by a factor of almost ten-to-one. For every bear, there are nearly ten bulls.
I find that an amazing situation, and I hope you do too.
All it would take is a little selling by the bulls to radically alter the course of the market. This is because any short-covering buying by the bears would likely be swamped by this selling. In other words, the market is dangerously poised with the risk now to the upside, rather than the downside.
Where there's smoke
But this data is telling me that when the reversal arrives, it will very likely be dramatic. It will be like everyone trying to leave a crowded room at once when someone shouts "Fire!"
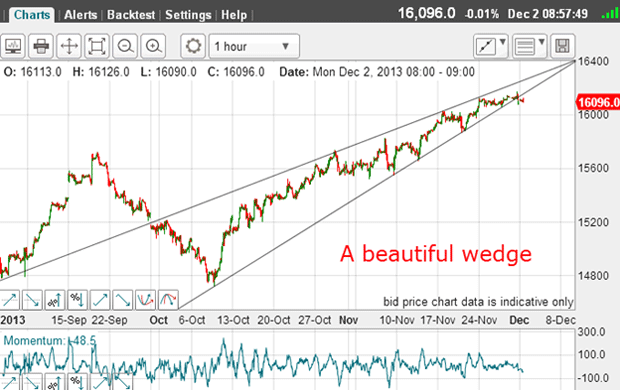
Here is the Dow this morning:

The rally off the early October low is contained within my very lovely wedge (or ascending triangle). Note the many accurate touch points on the lower line. This is a very reliable line of support.
After a long rally, such as we have seen from the 2009 low, an ascending triangle is usually a sign that the rally is getting exhausted. And a break of the lower line is usually the first sign of an impending decline.
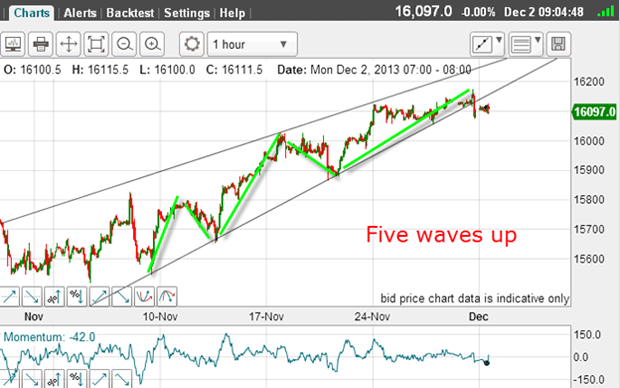
That is because the lower line has been a very reliable line of support. But now it has given way and therefore becomes a line of resistance.
And late on Friday, which was a holiday-shortened day, the market broke below my lower wedge line. Let's zoom in now:

A strong line of resistance
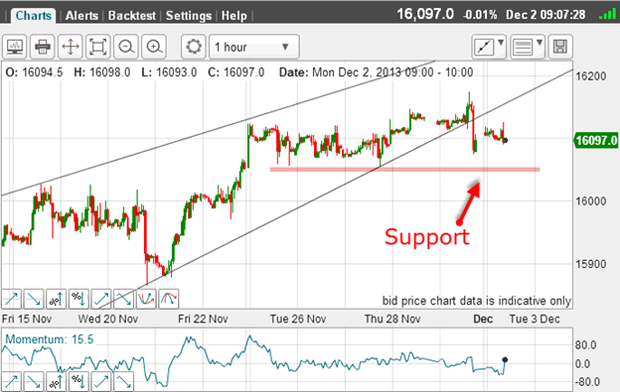
But let's zoom in even closer:

Early this morning, the market tried to rally up to the line in a traditional kiss, but so far it has not made it.
And a break of support at the pink bar should spell trouble for the rally.
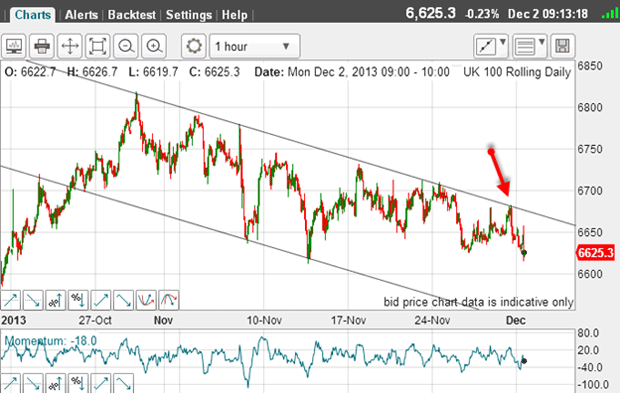
With the Dow looking wobbly here, how does the FTSE look?

On Friday, the market made another attempt at breaking above my tramline. But once again, the door was slammed shut. This resulted in at least seven, touch points with several near misses.
That is one very strong line of resistance. It would take a terrific effort to overcome it.
So the pink support bar is my line in the sand for the Dow.
Get the latest financial news, insights and expert analysis from our award-winning MoneyWeek team, to help you understand what really matters when it comes to your finances.
John is is a British-born lapsed PhD physicist, who previously worked for Nasa on the Mars exploration team. He is a former commodity trading advisor with the US Commodities Futures Trading Commission, and worked in a boutique futures house in California in the 1980s.
He was a partner in one of the first futures newsletter advisory services, based in Washington DC, specialising in pork bellies and currencies. John is primarily a chart-reading trader, having cut his trading teeth in the days before PCs.
As well as his work in the financial world, he has launched, run and sold several 'real' businesses producing 'real' products.
-
 Average UK house price reaches £300,000 for first time, Halifax says
While the average house price has topped £300k, regional disparities still remain, Halifax finds.
-
 Barings Emerging Europe trust bounces back from Russia woes
Barings Emerging Europe trust has added the Middle East and Africa to its mandate, delivering a strong recovery, says Max King