Another big test for the Dow bears
The Dow's death-defying rally has continued. But it's run into a strong level of resistance, says John C Burford. Will the bears be proved right after all?
Get the latest financial news, insights and expert analysis from our award-winning MoneyWeek team, to help you understand what really matters when it comes to your finances.
You are now subscribed
Your newsletter sign-up was successful
Want to add more newsletters?

Twice daily
MoneyWeek
Get the latest financial news, insights and expert analysis from our award-winning MoneyWeek team, to help you understand what really matters when it comes to your finances.

Four times a week
Look After My Bills
Sign up to our free money-saving newsletter, filled with the latest news and expert advice to help you find the best tips and deals for managing your bills. Start saving today!
Just to let you know, I'll be taking a break next week and the week after. But not before I've brought you up to date with the incredible moves on the Dow!
Let's get right to it. It's thrilling stuff!
Following Wednesday's big drop which I covered yesterday, the Dow staged yet another death-defying rally yesterday afternoon.
MoneyWeek
Subscribe to MoneyWeek today and get your first six magazine issues absolutely FREE

Sign up to Money Morning
Don't miss the latest investment and personal finances news, market analysis, plus money-saving tips with our free twice-daily newsletter
Don't miss the latest investment and personal finances news, market analysis, plus money-saving tips with our free twice-daily newsletter
Let's look at the damage it has done to my bearish case.
Yesterday's rally reverses the sell signals
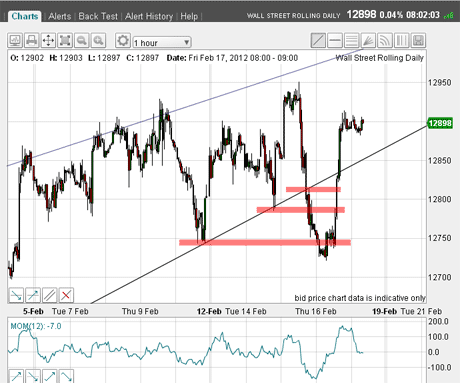
On Wednesday, the market broke below my lower wedge trendline as well as the two chart support levels, where I had placed short trades.
But yesterday's rally reversed these sell signals as the market moved back up through these levels. You can see that move here:

(Click on the chart for a larger version)
At first glance, it seems that my bearish stance is wrong again!
But not so fast I have one remaining line of defence, and it is this:

(Click on the chart for a larger version)
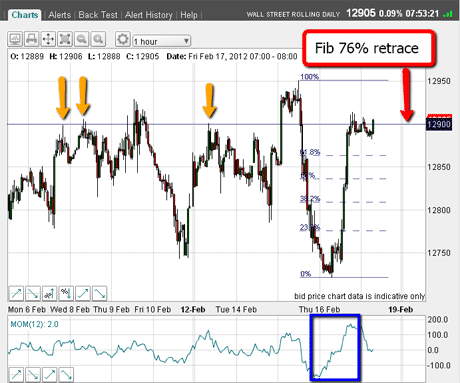
As of this morning, the rally has not made a new high above Wednesday's 12,950 high. It has only' reached the Fibonacci 76% retrace of Wednesday's decline.
Recall that the 12,950 level formed the end of the fifth wave of a bullish five-wave Elliott wave pattern. That level remains very strong resistance.
Also note the rapid turn-around in momentum readings as marked by the blue box. That was some shock to the system.
The market is now meeting strong resistance
Recall from previous Dow rallies which I have covered before that many of these rallies have stalled at very deep retracements often above the 76% and closer to the 87% levels.
Can this be yet another very deep retracement before the decline is resumed?
If so, they are teasing us bears mercilessly!
Note from the above chart that this 76% retrace level at the 12,900 area is also the level that has repelled a few previous rally attempts. I have marked these by the yellow arrows. The market clearly believes this is a significant resistance level.
Also, the rally off the Thursday morning low can be treated as an A-B-C pattern, with the C wave a very extended one. If true, we are still in a down-trending market. The implication is that there is more downside to come.
The alternative view is that if the market can push above the 12,900 level, a five-wave pattern could be formed. That would weaken my counter-trend argument.
It's still possible the Dow is forming a top
However, even if the market can push above the 12,950 level, a real top could still be imminent. The upper wedge trendline still passes through the 13,000 area, so there is room of about 100 pips above the current market for the market to finally top.
There's no denying, though, that with yesterday's development, it is now much harder for me to pin-point this elusive top.
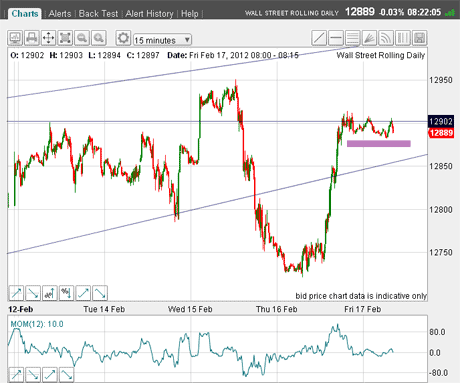
If I were an aggressive trader I would be thinking of setting sell stops around the level shown by the purple bar in the chart below:

(Click on the chart for a larger version)
If I was doing that, I would be relying on this Fibonacci 76% level to hold and the A-B-C rally pattern to be valid.
Naturally, I would employ my 3% rule to set protective stops in case the trade went wrong.
However, if I were a more conservative trader I would continue to wait and see if the Fibonacci levels will hold and to be ready to pounce if the market dropped below the lower wedge trendline again.
As I write this this morning, I can say that the market is displaying some topping action, but is less convincing than yesterday's chart. At some stage, I will get a clearer indication, but the time is not quite yet.
Now as I mentioned at the start, I'll be taking a break next week. My plan is to do one finalpost on Monday. But after that, I'll be away until 29 February.
If you're a new reader, or need a reminder about some of the methods I refer to in my trades, then do have a look at my introductory videos:
The essentials of tramline trading
An introduction to Elliott wave theory
Advanced trading with Elliott waves
Don't miss my next trading insight. To receive all my spread betting blog posts by email, as soon as I've written them, just sign up here .
Get the latest financial news, insights and expert analysis from our award-winning MoneyWeek team, to help you understand what really matters when it comes to your finances.
John is is a British-born lapsed PhD physicist, who previously worked for Nasa on the Mars exploration team. He is a former commodity trading advisor with the US Commodities Futures Trading Commission, and worked in a boutique futures house in California in the 1980s.
He was a partner in one of the first futures newsletter advisory services, based in Washington DC, specialising in pork bellies and currencies. John is primarily a chart-reading trader, having cut his trading teeth in the days before PCs.
As well as his work in the financial world, he has launched, run and sold several 'real' businesses producing 'real' products.
-
 Inheritance tax investigations net HMRC an extra £246m from bereaved families
HMRC embarked on almost 4,000 probes into unpaid inheritance tax in the year to last April, new figures show, in an increasingly tough crackdown on families it thinks have tried to evade their full bill
-
 Average UK house price reaches £300,000 for first time, Halifax says
While the average house price has topped £300k, regional disparities still remain, Halifax finds.