After the fall, where now for the Dow?
With Elliott wave analysis painting a very bearish picture, the Dow's big fall is no surprise at all, says John C Burford. It’s sticking firmly to the script. So where is it headed now?
Get the latest financial news, insights and expert analysis from our award-winning MoneyWeek team, to help you understand what really matters when it comes to your finances.
You are now subscribed
Your newsletter sign-up was successful
Want to add more newsletters?

Twice daily
MoneyWeek
Get the latest financial news, insights and expert analysis from our award-winning MoneyWeek team, to help you understand what really matters when it comes to your finances.

Four times a week
Look After My Bills
Sign up to our free money-saving newsletter, filled with the latest news and expert advice to help you find the best tips and deals for managing your bills. Start saving today!
How's that for timing?
No sooner had I finished writing on Wednesday than the market made a brief spurt higher, and then fell very hard again yesterday. There was simply no respite from the selling until the close.
That confirmed my view that after breaching the shelf of support at the 11,300 level, the market would fall heavily towards the 10,800 area.
MoneyWeek
Subscribe to MoneyWeek today and get your first six magazine issues absolutely FREE

Sign up to Money Morning
Don't miss the latest investment and personal finances news, market analysis, plus money-saving tips with our free twice-daily newsletter
Don't miss the latest investment and personal finances news, market analysis, plus money-saving tips with our free twice-daily newsletter
Recall that my Elliott wave count was for the 10,540 low to be a third Elliott wave, then a rally in an A-B-C pattern in the fourth wave, and then a new low below 10,540 for the final fifth wave (yet to be made).
That remains my view.
OK, let's back up to Wednesday. I noted that a tramline touch at the 11,480 area looked a great place for me to place a short trade.
That was where a very probable C wave was being put in, and with a potential negative momentum divergence.
The odds highly favoured a top there.
It's always a good idea to look back at the big picture
But before I go into my analysis and forecasts, I want to remind you of the big picture.
Trading Tip: It is always a good idea to examine the long-range (daily and weekly) charts at least once a week. It reminds you of where you are in the larger trends.
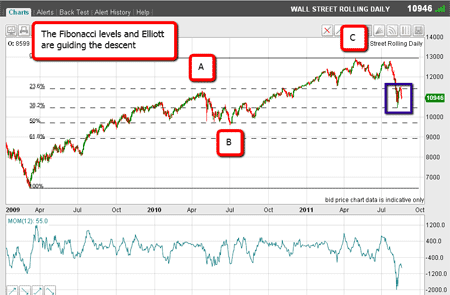
Here is the daily Dow chart going back to the incredible 6,450 low in March 2009:

(Click on the chart for a larger version)
I have drawn the Fibonacci retracements of the entire rise from there to the 12,850 high made in April (I believe we can consider this as the' top).
I have also marked the two-year plus rally as an A-B-C correction.
That clearly is a corrective pattern, and now the market is resuming its downtrend which was interrupted by the rally.
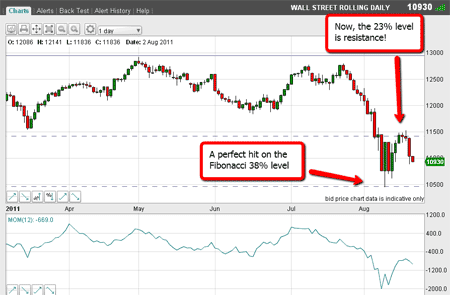
I have blown up the recent period here:

(Click on the chart for a larger version)
The recent plunge to the 10,450 level took it right to the Fibonacci 38% retrace. Isn't that pretty?
But just as pretty is the bounce right up to the 23% level!
Using tramlines to pinpoint the turning point
But as I explained on Wednesday, I had other reasons why I believed the bounce would end there and that involved my tramlines.
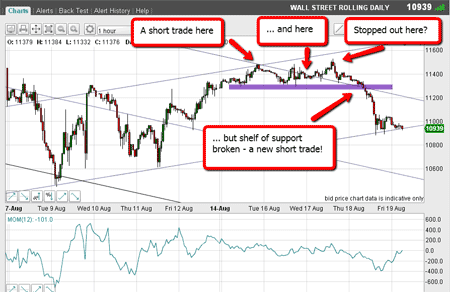
Here is the hourly chart:

(Click on the chart for a larger version)
I had a short trade at the tramline at the 11,450 area, but also a possible trade as the market later touched the tramline.
But the market wasn't quite ready to give up the ghost and rallied towards my upper up-sloping tramline.
Some protective stops were probably hit on this spurt for a loss (which was within 3%, of course).
However, there was another great opportunity for a short trade as the market plunged right through my shelf of support (marked by thepurple bar).
The market was falling, as I had forecast. But where would it bounce?
Short-term traders will have a firm target in mind in order to take profits.
Last Wednesday, I drew a new pair of up-sloping tramlines. My first downside target was to be around the lower tramline in the 10,800 area.
As it happened, the market did fall yesterday right to my lower tramline and is currently staging a bounce. That's very pretty and that is where short-term traders were taking profits of 400 pips plus (£400 per £1 bet).
Trading Tip: When you have tramlines you feel are reliable, use their projections to fix your targets. But remember, targets should be used as minimum objectives. Markets frequently move past my targets and on to the next. If you are a hit-and-run type trader, you will get out on the first opportunity.
Elliott wave analysis is painting a very bearish picture
But I have another method to estimate if the current trend will continue or will turn and that is Elliott wave analysis.
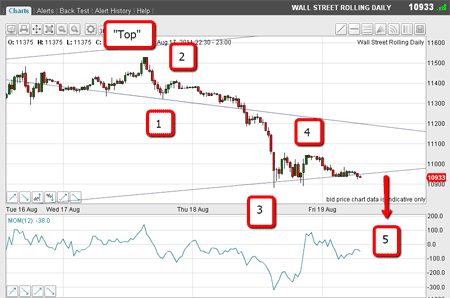
Here is the 30-minute chart of the move down from Wednesday's mini-top:

(Click on the chart for a larger version)
I can count four clear waves, with wave 3 being strong and producing oversold' momentum readings.
If my count is correct, we are this morning in wave 4, and a wave 5 to new lows should follow.
At this stage, I do not know how far wave 5 will reach. Fifth waves can be very extended (such as the current wave in gold, which I hope to cover again soon).
Selling pressure remains intense, and so the centre down-sloping tramline at the 10,500 area is a possible target.
Incidentally, long-term traders will still be holding short trades taken at the 12,800 area looking for much lower levels in due course.
The long-term Elliott wave picture is clear and very bearish.
Also, I am reading much more mention of the D' word in the mainstream media. This is a classic sign of a slowly-dawning recognition of the economic and social abyss we are facing.
When a significant low is reached, almost everyone will be extremely bearish. And that will be the time to buy!
Don't miss my next trading insight. To receive all my spread betting blog posts by email, as soon as I've written them, just sign up here .
Get the latest financial news, insights and expert analysis from our award-winning MoneyWeek team, to help you understand what really matters when it comes to your finances.
John is is a British-born lapsed PhD physicist, who previously worked for Nasa on the Mars exploration team. He is a former commodity trading advisor with the US Commodities Futures Trading Commission, and worked in a boutique futures house in California in the 1980s.
He was a partner in one of the first futures newsletter advisory services, based in Washington DC, specialising in pork bellies and currencies. John is primarily a chart-reading trader, having cut his trading teeth in the days before PCs.
As well as his work in the financial world, he has launched, run and sold several 'real' businesses producing 'real' products.
-
 ISA fund and trust picks for every type of investor – which could work for you?
Whether you’re an ISA investor seeking reliable returns, looking to add a bit more risk to your portfolio or are new to investing, MoneyWeek asked the experts for funds and investment trusts you could consider in 2026
-
 The most popular fund sectors of 2025 as investor outflows continue
It was another difficult year for fund inflows but there are signs that investors are returning to the financial markets