A tricky trade in the euro market
The euro has been following its own path lately and has proven a very difficult market to trade. John C Burford looks at what's been going on, and examines a few cautious trades in a difficult market.
Get the latest financial news, insights and expert analysis from our award-winning MoneyWeek team, to help you understand what really matters when it comes to your finances.
You are now subscribed
Your newsletter sign-up was successful
Want to add more newsletters?

Twice daily
MoneyWeek
Get the latest financial news, insights and expert analysis from our award-winning MoneyWeek team, to help you understand what really matters when it comes to your finances.

Four times a week
Look After My Bills
Sign up to our free money-saving newsletter, filled with the latest news and expert advice to help you find the best tips and deals for managing your bills. Start saving today!
As promised, I am today covering the EUR/USD, which I last wrote about on 12 September: The powerful waves washing over the euro market. Since then, the market has not collapsed in a third Elliott wave, as I suggested it might do then.
If you have not seen my video tutorial on how I use Elliott waves, watch it here: An introduction to Elliott wave theory.
This illustrates that as traders, we have to make forecasts as to the most likely future course for the markets. None of us has a crystal ball, so we have to make the best of the information at hand at the time.
MoneyWeek
Subscribe to MoneyWeek today and get your first six magazine issues absolutely FREE

Sign up to Money Morning
Don't miss the latest investment and personal finances news, market analysis, plus money-saving tips with our free twice-daily newsletter
Don't miss the latest investment and personal finances news, market analysis, plus money-saving tips with our free twice-daily newsletter
But if the market does not behave according to our ideas, we need to alter our stance and I have done so.
The absolute golden rule in trading is to never take a big hit on your account and to use sensible money management rules, such as my 3% rule.
Trading tip: Never become married to a particular view - let the market tell you what it wants to do. Remember: divorce never comes cheap!
The charts predicted a big move - but which way?
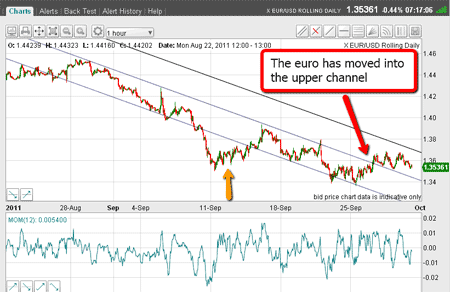
OK, what has the market given us since 12 September? Here is the chart as of this morning:
(Click on the chart for a larger version)
I have drawn in my tramline trio off the high of late August and have marked the 12 September date with the yellow arrow.
As can be seen, the market did not fall hard, but traded in a corrective fashion with many overlapping waves.
This type of action usually precedes a very large move, but the question is in what direction?
Since moving into the upper channel, the market has tried to get back below my central tramline, but has 'kissed' it and moved back up.
Does this mean the upper target is my upper tramline in the 1.37 area?
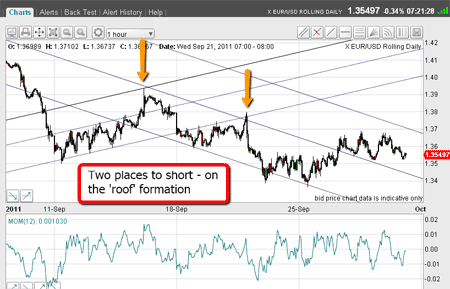
Here is a close-up for the chart from the 12 September:
(Click on the chart for a larger version)
The first period from 12-16 September has a rising trend, and I have placed my tramline trio.
When the market moved up through the central tramline, I could set my upper target at the third (upper tramline).
Conveniently, that is exactly where this up-sloping tramline meets my down-sloping central tramline from the first chart! Where the tramlines cross, it is taking the form of a hat, or roof (marked by the first yellow line).
Trading tip: In my advanced tramline trading video tutorial, I show the importance of these tramline crossing events. In this case, the roof is keeping the rally contained.
Then, on 21 September, the rally carried to another 'roof', where short trades were indicated. I have marked the second roof with a yellow arrow too.
Things are getting complicated, but there are some great lessons to be learned
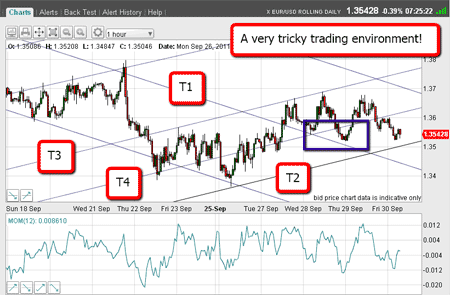
OK, let's move on to more recent trading. Here is the chart showing the action for the past week:
(Click on the chart for a larger version)
I'm afraid the tramlines look a little complex, but I hope you stay with this, as there are some great lessons from this chart.
I have drawn in my new up-sloping tramlines (T2, T4, T3) which contain some excellent touch-points, especially T3.
Note that the market tried to get past T1 (the downsloping tramline) but this tramline provided good support (area marked with purple box).
As the market was trading up to T3 on Wednesday, it then fell on Thursday to below T4.
I was getting interested in a short trade as the market was moving back down.
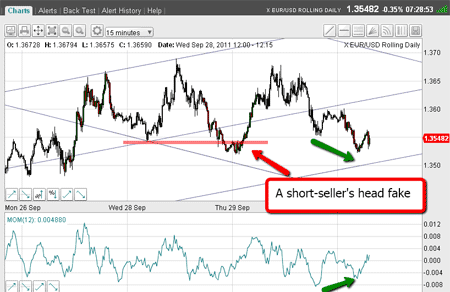
But hold your horses take a look at this close-up:
(Click on the chart for a larger version)
When support at the purple bar had given way, that seemed to confirm the down-move. I decided to place a short trade.
But the market had other ideas!
In a classic 'head-fake', it just turned around and headed up. So it was good that I had my protective stop in place to take me out for a small loss.
Trading tip: Even when all signals are lined up in your direction, the market can surprise, so be prepared with protective stops.
The potential is there for a massive rally. But from where?
But take a look at the potential positive momentum divergence at the lows. The potential is there for a massive rally.
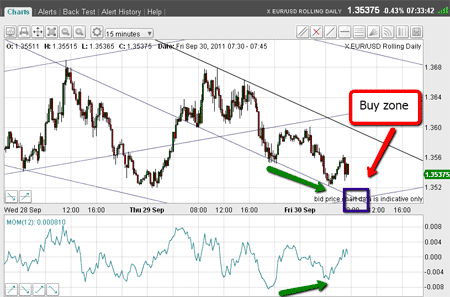
But where will the market likely rally from? Here is the latest chart:
(Click on the chart for a larger version)
I have drawn my down-sloping tramlines from yesterday's high and they contain many excellent touch-points. The lower one especially hits all the lows, so it will probably continue to hold as support from here.
But note the up-sloping tramline from my first chart coming up to meet it.
The crossing (marked by the purple box) is a 'cup' the inverse of the 'roof' - so I expect even stronger support if the market can make it down there. That, combined with the possible positive momentum divergence should give me an opportunity to cover any shorts and go long.
Let's see how this works out.
If you're a new reader, or need a reminder about some of the methods I refer to in my trades, then do have a look at my introductory videos:
The essentials of tramline trading
An introduction to Elliott wave theory
Don't miss my next trading insight. To receive all my spread betting blog posts by email, as soon as I've written them, just sign up here .
Get the latest financial news, insights and expert analysis from our award-winning MoneyWeek team, to help you understand what really matters when it comes to your finances.
John is is a British-born lapsed PhD physicist, who previously worked for Nasa on the Mars exploration team. He is a former commodity trading advisor with the US Commodities Futures Trading Commission, and worked in a boutique futures house in California in the 1980s.
He was a partner in one of the first futures newsletter advisory services, based in Washington DC, specialising in pork bellies and currencies. John is primarily a chart-reading trader, having cut his trading teeth in the days before PCs.
As well as his work in the financial world, he has launched, run and sold several 'real' businesses producing 'real' products.
-
 Average UK house price reaches £300,000 for first time, Halifax says
While the average house price has topped £300k, regional disparities still remain, Halifax finds.
-
 Barings Emerging Europe trust bounces back from Russia woes
Barings Emerging Europe trust has added the Middle East and Africa to its mandate, delivering a strong recovery, says Max King