A trade set-up in the AUS/USD market?
That the 'Aussie' has come under pressure from China is common knowledge. That's great for swing traders, says John C Burford.
Get the latest financial news, insights and expert analysis from our award-winning MoneyWeek team, to help you understand what really matters when it comes to your finances.
You are now subscribed
Your newsletter sign-up was successful
Want to add more newsletters?

Twice daily
MoneyWeek
Get the latest financial news, insights and expert analysis from our award-winning MoneyWeek team, to help you understand what really matters when it comes to your finances.

Four times a week
Look After My Bills
Sign up to our free money-saving newsletter, filled with the latest news and expert advice to help you find the best tips and deals for managing your bills. Start saving today!
The 'aussie' has recently come under sustained pressure and it's not difficult to see why.
China's economy is slowing, so demand for Australia's natural resources is expected to drop with a knock-on effect on the currency. China is Australia's biggest customer.
But as we should all know by now, when a story built on fundamentals' becomes obvious to the majority, its importance to your trading can be overestimated.
MoneyWeek
Subscribe to MoneyWeek today and get your first six magazine issues absolutely FREE

Sign up to Money Morning
Don't miss the latest investment and personal finances news, market analysis, plus money-saving tips with our free twice-daily newsletter
Don't miss the latest investment and personal finances news, market analysis, plus money-saving tips with our free twice-daily newsletter
Here, I will lay out my thinking when I examine a relatively unfamiliar market the AUS/USD. I did a similar thing on Friday with the USD/CAD.
Stage 1: The weekly chart any Elliott waves?
Here is the weekly going back to 2008:
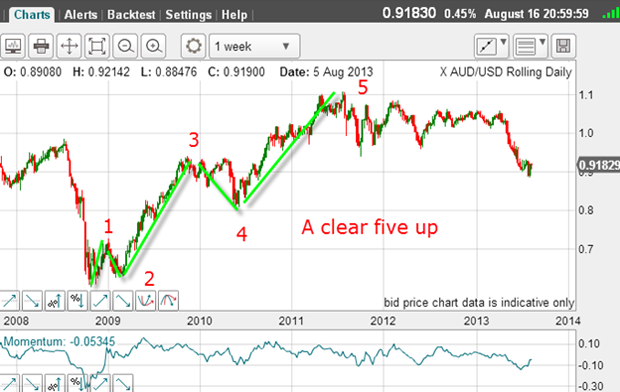
The huge bull market from 0.60 to 1.10 (5,000 pips!) from late 2008 to the high in mid-2011 is in a clear five-wave pattern.
The fifth wave is the longest, and I can see a five-wave sequence within:
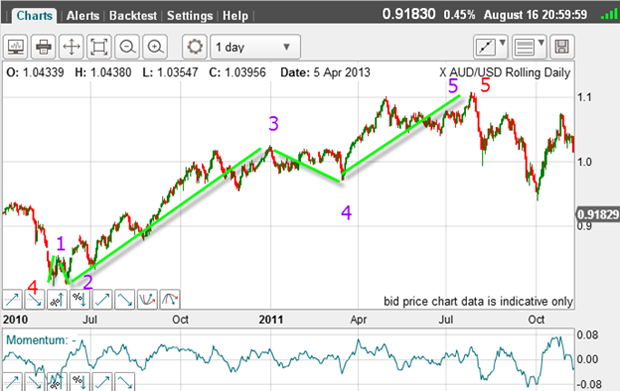
And within my wave 3, there is another smaller five-wave pattern and another even smaller five-wave pattern within that.
Note that all of the corrective (down) moves are A-B-Cs, showing the main trend remained up until the final fifth waves were in place.
Remember, an A-B-C is a highly reliable litmus test for the direction of the prevailing trend.
But after a large five-wave move comes a period of consolidation. That is what we have, albeit a very complex one taking about two years so far.
Stage 2: The daily chart any Elliott waves?
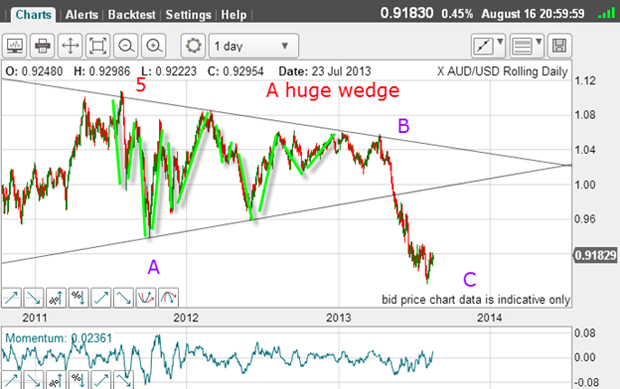
The swings are violent and the market is extremely volatile. This is a very tricky market to trade it's best left to the professionals. I certainly only trade it sporadically.
But note all of the large up and down waves are in threes. This makes the whole episode a corrective and consolidating pattern inside a very large wedge formation.
So we have had the five up, and now I look for three down in an A-B-C.
The move out of the wedge was a classic impulse that quickly broke below the lower wedge boundary.
I have labelled the first down leg inside the wedge as wave A and the final high before the big drop as wave C. This is a standard Elliott wave custom.
Now I need to examine the C wave to see where it is likely to end. If I can do this accurately, I have a possible trade, looking for a resumption of the long-term uptrend, keeping in mind that C waves can be long and strong after all, C waves often have the same character as third waves.
Because of this, I will be looking for a five-wave pattern in this C wave. If I can locate the fifth wave low, I will have a candidate for the C wave low.
But now, I must look for a possible tramline off the upper wedge line. And here it is:
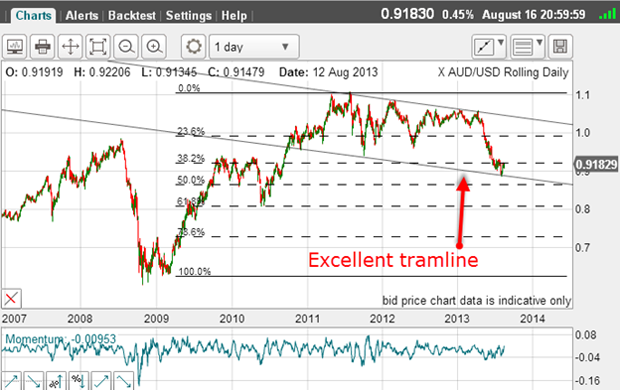
It has several touch points and the market is currently on this line of support. This confirms that wave A = wave C, which is a common Elliott wave relationship. That is valuable information.
I have also drawn in the Fibonacci levels and again, the market is currently testing the 38% level. Also, the market is into chart support from 2009-2010. This all suggests the C wave may well be at its low, or very near to it.
If the market can rally from here, that would make my A-B-C labels highly convincing.
The implication, of course, is that the market has finished correcting the five up to the 2011 high and is ready to embark on the next rally leg.
Stage 3 The C wave any Elliott waves?
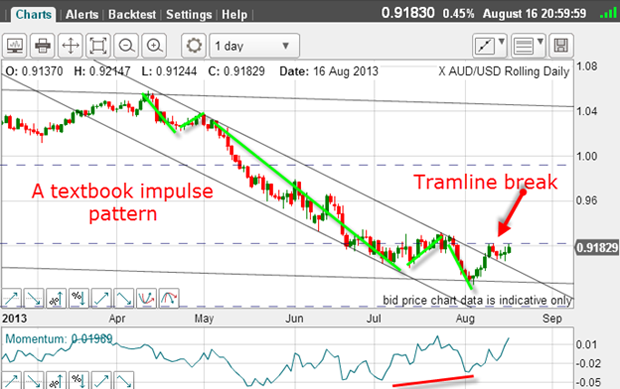
And here it is, in textbook form. The third wave is long and strong with a positive-momentum divergence at wave 5.
And wave 5 has hit the long-term tramline support on cue.
Not only that, but we now have an upside tramline break. This is confirming evidence that the C wave low is likely in. This is starting to look like a very interesting set up!
So, I have a complete five waves down in the C wave, a tramline support hit, and a tramline break.
In this case a five wave move down does not mean the one larger trend is down. It means the C wave has terminated and the next move is up.
It is easy to be confused with five wave patterns. In C waves, it indicates the termination of the C wave. In third waves of a five-wave sequence, it indicates the wave 3 has terminated, but the one larger trend remains after a wave 4 correction.
There is another possibility. My wave 5 could turn out to be wave 3 and after a bounce in wave 4, we could see another low in a new wave 5.
But the evidence is piling up that we have a high-probability, low-risk trade set-up here.
Is the market poised for a large rally phase? Time to look at the commitments of traders (COT) data:
| (Contracts of AUD 100,000) | Row 0 - Cell 1 | Row 0 - Cell 2 | Row 0 - Cell 3 | Open interest: 184,822 | ||||
| Commitments | ||||||||
| 12,625 | 75,346 | 1,684 | 154,583 | 71,806 | 168,892 | 148,836 | 15,930 | 35,986 |
| Changes from 08/06/13 (Change in open interest: -17,063) | ||||||||
| -3,941 | -17,999 | 430 | -12,419 | 7,040 | -15,930 | -10,529 | -1,133 | -6,534 |
| Percent of open in terest for each category of traders | ||||||||
| 6.8 | 40.8 | 0.9 | 83.6 | 38.9 | 91.4 | 80.5 | 8.6 | 19.5 |
| Number of traders in each category (Total traders: 92) | ||||||||
| 21 | 36 | 13 | 21 | 23 | 48 | 66 | Row 8 - Cell 7 | Row 8 - Cell 8 |
For the week ending 13 August, the specs did reduce their short exposure, but still remain heavily weighted to the short side. The hedgies are almost six-to-one bearish and the small specs are over two-to-one bearish.
As we have seen with other markets, when hedge funds are so crowded to one side of the boat, it often capsizes. The potential is there for a significant rally.
The key for the bull case is the previous high at 0.93 from June and July. If the market can breach that resistance level, we would very likely be in a new third wave up with targets in the 0.96 area.
Because this is a great example of how I use my methods of analysis in real-time trading, I intend to keep following this one with regular updates. I believe it is shaping up to become a classic.
Get the latest financial news, insights and expert analysis from our award-winning MoneyWeek team, to help you understand what really matters when it comes to your finances.
John is is a British-born lapsed PhD physicist, who previously worked for Nasa on the Mars exploration team. He is a former commodity trading advisor with the US Commodities Futures Trading Commission, and worked in a boutique futures house in California in the 1980s.
He was a partner in one of the first futures newsletter advisory services, based in Washington DC, specialising in pork bellies and currencies. John is primarily a chart-reading trader, having cut his trading teeth in the days before PCs.
As well as his work in the financial world, he has launched, run and sold several 'real' businesses producing 'real' products.
-
 Average UK house price reaches £300,000 for first time, Halifax says
While the average house price has topped £300k, regional disparities still remain, Halifax finds.
-
 Barings Emerging Europe trust bounces back from Russia woes
Barings Emerging Europe trust has added the Middle East and Africa to its mandate, delivering a strong recovery, says Max King