A USD/CAD currency trade in three steps
John C Burford trades the US dollar against its Canadian counterpart, and describes step-by-step what thoughts should go through a trader's mind.
Get the latest financial news, insights and expert analysis from our award-winning MoneyWeek team, to help you understand what really matters when it comes to your finances.
You are now subscribed
Your newsletter sign-up was successful
Want to add more newsletters?

Twice daily
MoneyWeek
Get the latest financial news, insights and expert analysis from our award-winning MoneyWeek team, to help you understand what really matters when it comes to your finances.

Four times a week
Look After My Bills
Sign up to our free money-saving newsletter, filled with the latest news and expert advice to help you find the best tips and deals for managing your bills. Start saving today!
Today I want to describe my thought process when I analyse a market for a possible trade set-up. I hope this will help to you understand what's important to consider and what isn't.
This will be my diary of events starting on Wednesday and I will publish it win, lose or draw as usual on Friday.
You know, one of the great benefits of having just a basic understanding of Elliott wave theory is that, not only does it help you plot a likely road map for your trades, but it can tell you where your analysis is wrong at a particular price level.
MoneyWeek
Subscribe to MoneyWeek today and get your first six magazine issues absolutely FREE

Sign up to Money Morning
Don't miss the latest investment and personal finances news, market analysis, plus money-saving tips with our free twice-daily newsletter
Don't miss the latest investment and personal finances news, market analysis, plus money-saving tips with our free twice-daily newsletter
This is valuable information. It can provide you with specific levels where you can place your protective stops. Many traders without this knowledge just place them using their intuition there is no logic behind it.
There are three stages to a trade: analyse the market using your time-tested methods, judge your initial entry and risk, and then manage the risk to completion.
I will start this trade on Wednesday, as I spotted an opportunity then.
All of these notes are being written in real time, starting on Wednesday afternoon.
Determine any long-term trend on the daily
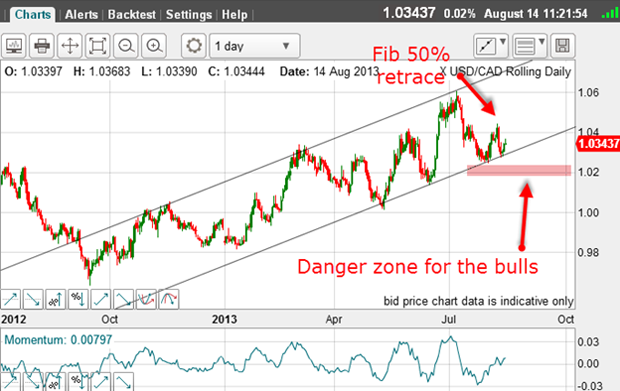
Well, at least my upper one is lovely! That one takes in the major highs from last year and has a solid prior pivot point (PPP). The lower line is OK, since it captures the most recent touch points.
So, from October last year, the market has been in an uptrend.
But as we know from Elliott wave theory, all bull markets should have a five-wave structure to be genuine. Look as I might, I cannot see one. All I see is a series of highly overlapping waves in the trading channel. This means that this is not a true impulse wave, with the larger direction up.
I can therefore start looking for a possible turn down. That is my main task now.
Trader tip: If you cannot see an immediate Elliott-wave pattern that you recognise, there probably isn't one and you should just move on to the next chart.
But following the move down from the latest touch point on the upper line in July, I can count five waves down:
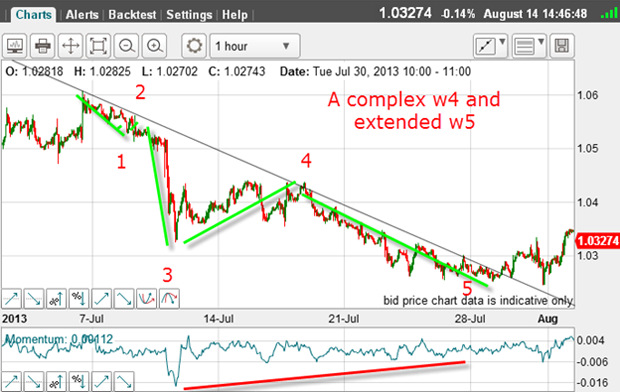
Wave three is not long, but it is strong, and there is a huge positive-momentum divergence at wave five (the red bar).
This is a textbook impulse pattern and it indicates that the one larger trend is now down. Now I am looking for a three-wave counter-trend move which would confirm this thesis - and hence an opportunity to short in the direction of the main trend.
Determine the short-term trend
With the trendline break, I can now apply my Fibonacci levels. I am confident that the short-term low is in at wave five.
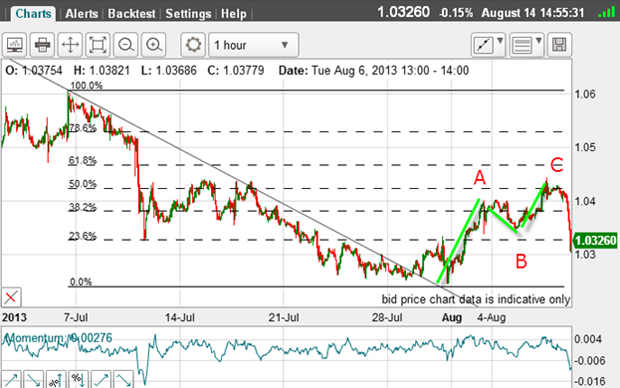
And sure enough, the market makes a clear A-B-C with the C wave hitting the Fibonacci 50% retrace a very common level at which C waves terminate.
This, then, is a possible area to look for my short entry, and is helping determine the short-term trend as being down.
But what are the tramlines saying?
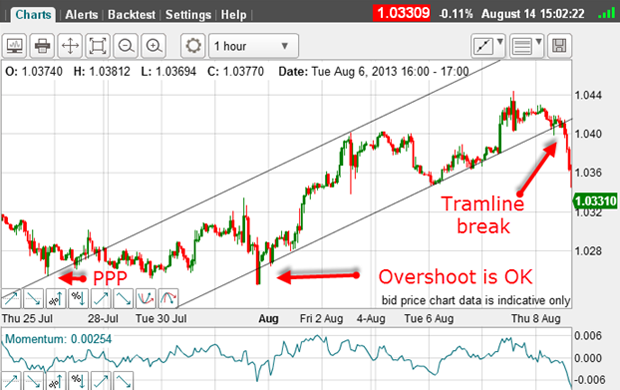
I have a solid lower tramline and my upper one has only one touch point and a PPP. But the point is, I have a tramline break, which is what I was waiting for.
With the A-B-C counter-trend pattern and the tramline break, that suggests the trend is now down. I entered my short trade with a protective stop just above the minor high in the 1.0430 area.
So now I have a short trade at the 1.390 level with a stop at 1.0430 for a 40-pip risk.
What is my target for this trade?
That is when I draw in other tramlines:
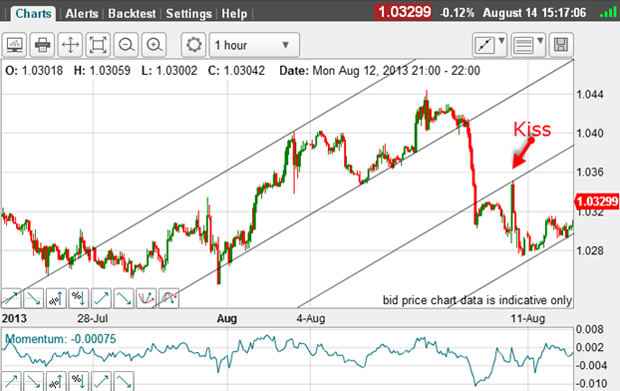
And sure enough, we have four tramlines working with a textbook kiss. These will guide my search for a place to possibly exit the trade.
To really reassure that the trend is now down, I need to see a five-wave move down now from the 1.0440 level.
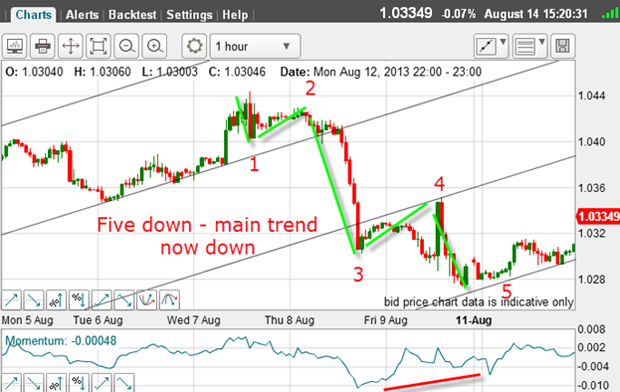
And here it is complete with a large positive-momentum divergence at wave five low.
As the market moved down in wave three, I moved my protective stop to break-even at 1.0390. But the quick move down to the lower tramline was the place I would take my profits of around 100 pips.
So what now? Well, an A-B-C corrective move, of course!
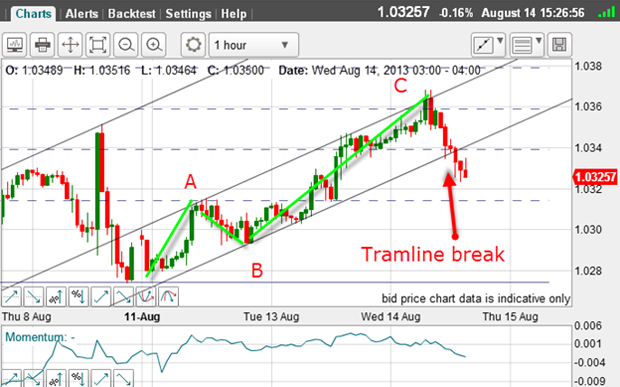
And right on cue, we have an A-B-C with the rally carrying to the 50% Fibonacci retrace! Isn't that pretty? It's a great place to re-enter a short another trade.
I have also a minor tramline drawn across the tops with a PPP.
Longer-term traders may have decided not to take profits previously and use this as an opportunity to add to positions.
It is certainly an ideal place for me to enter a short with a protective stop placed at the 1.0390 area for another very low-risk trade.
So I have another short trade at 1.0350 with a 40-pip risk.
Manage the risk/trade
On Thursday morning, the market made yet another A-B-C counter-trend rally right to the Fibonacci 50% level. The 50% retrace is getting to be a common feature of this market!
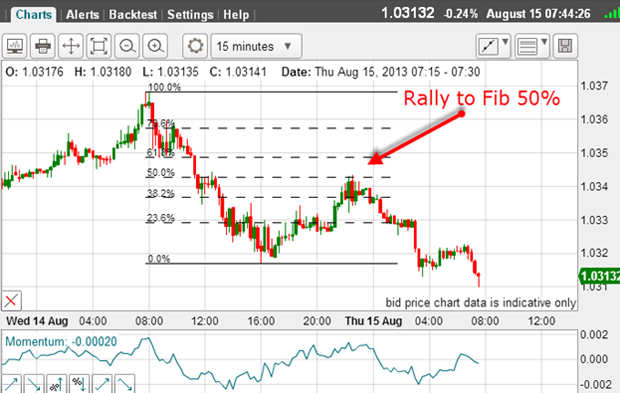
So now the market is heading for the 9 Aug low at 1.0280 my main target.
In the last few minutes, the market has moved lower, and now I can move my stop to break-even for a no-risk trade at the very least. The trade is 40 pips in profit.
But the market has hit the Fibonacci 62% level and into chart support:
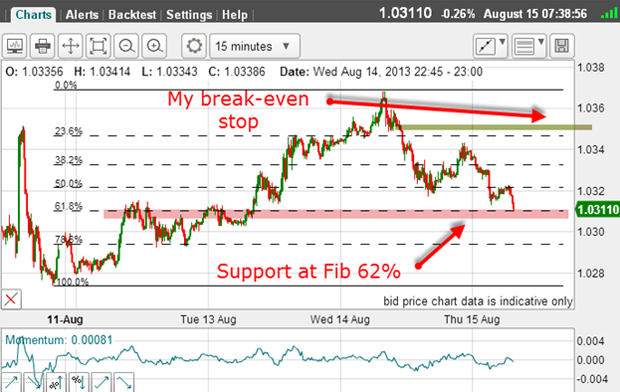
So now, I expect a bounce of some kind as the support should hold the decline around here. If not, then it's on our way towards the 1.0280 low with a possible stop at the Fibonacci 76% level at the 1.0290 area.
But on Thursday, during the volatility caused by the release of fresh US economic data, the market did bounce off the Fibonacci 62% level and took me out on my stop on the spike at 1.0350:

That was a no-loss trade.
But the market resumed its decline after the spike, and this morning, it is bouncing off the Fibonacci 76% level.
Many traders would feel annoyed and frustrated at having been stopped out on a momentary spike and see the market go their way shortly after. But this was a well-managed trade.
Why? Because when the market spiked up, there was no way to say the rally would not continue much higher and produce a possibly large loss if no stop were in place. Your capital is intact and you are free to search for your next trade.
Never forget the three rules of trading: manage risk, manage risk, and manage risk!
If you focus on these, you have every chance of being a great trader.
Now, on to the next trade and I may have one already:

I will allow you the chance to analyse this one!
Get the latest financial news, insights and expert analysis from our award-winning MoneyWeek team, to help you understand what really matters when it comes to your finances.
John is is a British-born lapsed PhD physicist, who previously worked for Nasa on the Mars exploration team. He is a former commodity trading advisor with the US Commodities Futures Trading Commission, and worked in a boutique futures house in California in the 1980s.
He was a partner in one of the first futures newsletter advisory services, based in Washington DC, specialising in pork bellies and currencies. John is primarily a chart-reading trader, having cut his trading teeth in the days before PCs.
As well as his work in the financial world, he has launched, run and sold several 'real' businesses producing 'real' products.
-
 MoneyWeek Talks: The funds to choose in 2026
Podcast Fidelity's Tom Stevenson reveals his top three funds for 2026 for your ISA or self-invested personal pension
-
 Three companies with deep economic moats to buy now
Opinion An economic moat can underpin a company's future returns. Here, Imran Sattar, portfolio manager at Edinburgh Investment Trust, selects three stocks to buy now