A textbook resistance trade in the euro
The euro has been sliding in recent days. But with sentiment turning sharply negative, will it keep falling? Or is it due a bounce? John C Burford looks at the charts to see.
Get the latest financial news, insights and expert analysis from our award-winning MoneyWeek team, to help you understand what really matters when it comes to your finances.
You are now subscribed
Your newsletter sign-up was successful
Want to add more newsletters?

Twice daily
MoneyWeek
Get the latest financial news, insights and expert analysis from our award-winning MoneyWeek team, to help you understand what really matters when it comes to your finances.

Four times a week
Look After My Bills
Sign up to our free money-saving newsletter, filled with the latest news and expert advice to help you find the best tips and deals for managing your bills. Start saving today!
Just before I start today's email, I'd like to say many thanks to all of you who attended my talk at the MoneyWeek conference last week for your terrific feedback on my blogs. It was great to meet you all.
If you didn't manage to get hold of a ticket, you can find out how to get a recording of the whole conference, including my talk along with others from James Ferguson, Merryn Somerset Webb and Dominic Frisby, here.
And now let's get back to where we were in the EUR/USD market.
MoneyWeek
Subscribe to MoneyWeek today and get your first six magazine issues absolutely FREE

Sign up to Money Morning
Don't miss the latest investment and personal finances news, market analysis, plus money-saving tips with our free twice-daily newsletter
Don't miss the latest investment and personal finances news, market analysis, plus money-saving tips with our free twice-daily newsletter
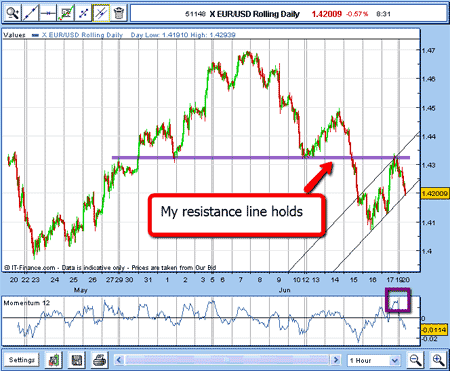
Last Friday (17 June), when I left it, the EUR/USD had retraced to the Fibonacci 76.4% level: The importance of a good support level in a fast-moving currency trade, where I suggested there could be a bounce to correct the very short-term oversold momentum reading.
I said that if I were a short-term trader I could be taking profits on a short position there.
I also said that if I saw an A-B-C (three-wave) bounce up to the overhead resistance area at the 1.4330 on wave C, that could be a good place to short again.
Here is this Monday morning's chart:

(Click on the chart for a larger version)
As we can see, the market followed my script in textbook fashion, with a rally to this overhead resistance (on overbought momentum shown with my purple box), and then a good move down, which is continuing this morning as I write.
Let's zero in on this move:

(Click on the chart for a larger version)
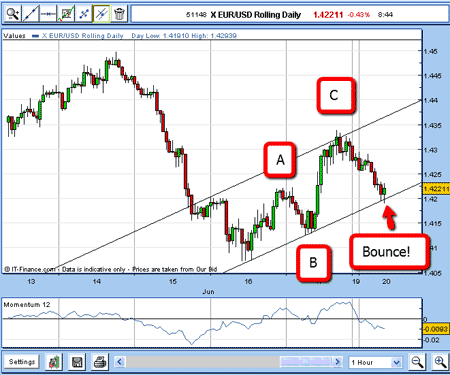
Now with the A-B-C rally complete, I can draw some tramlines. Connecting the Thursday and Friday lows, that gives me my lower tramline.
Then I can draw a parallel line using my parallel tool on my spread betting platform, and I find the upper line passes through the wave C high and also passes through the minor tops of last Wednesday/Thursday.
That makes the tramline pair a good working hypothesis.
If that is so, because the tramlines are lines of support and resistance, I can expect a drop to the lower line to be where a possible bounce starts.
So, a short trade taken at wave C could be covered when the market drops to my lower tramline.
And this morning, the market has made it to my lower tramline for a decent 200 pip short-term profit.
But what will happen next?
But now what? Will the market stage a good bounce, or will it just plunge through my lower tramline?
Most traders face these kind of questions! And they are impossible to answer with any confidence!
All we can do as traders is to posit scenarios, and here are some:
1. If the market falls through and challenges the low of wave B, a good policy would be to place sell-stops just below wave B to re-enter. The odds would be that the downtrend had resumed. Protective stops could then be entered using my 3% rule;
2. Or if the market does stage a good rally, it might rally to my upper tramline again, and I would be looking to short again;
3. Or it might trade in a narrow range for a long time and not offer any decent opportunities for short-term trading;
4. Or if I have a long-term view and I want to enter wide stops (still using my 3% rule!), I could enter at any time and walk away.
My view at the moment is that a bounce from here is in order, if only because my tramlines have proven themselves to be formidable lines of support. Also, the mood has suddenly turned negative on the euro, and that is often a reason to suspect a pause in the trend.
The markets seem perverse when you start studying them, but they do follow their own logic.
This logic is contrary to the kind of logic we use in everyday life, which is why Joe Granville's maxim is so true: "When most people think it is obvious, then it is obviously wrong".
How very zen!
NB: Don't miss my next trading insight. To receive all my spread betting blog posts by email, as soon as I've written them, just sign up here .
Get the latest financial news, insights and expert analysis from our award-winning MoneyWeek team, to help you understand what really matters when it comes to your finances.
John is is a British-born lapsed PhD physicist, who previously worked for Nasa on the Mars exploration team. He is a former commodity trading advisor with the US Commodities Futures Trading Commission, and worked in a boutique futures house in California in the 1980s.
He was a partner in one of the first futures newsletter advisory services, based in Washington DC, specialising in pork bellies and currencies. John is primarily a chart-reading trader, having cut his trading teeth in the days before PCs.
As well as his work in the financial world, he has launched, run and sold several 'real' businesses producing 'real' products.
-
 Average UK house price reaches £300,000 for first time, Halifax says
While the average house price has topped £300k, regional disparities still remain, Halifax finds.
-
 Barings Emerging Europe trust bounces back from Russia woes
Barings Emerging Europe trust has added the Middle East and Africa to its mandate, delivering a strong recovery, says Max King